Estrategia de trading cuantitativo basada en la inversión del pivote

Descripción general
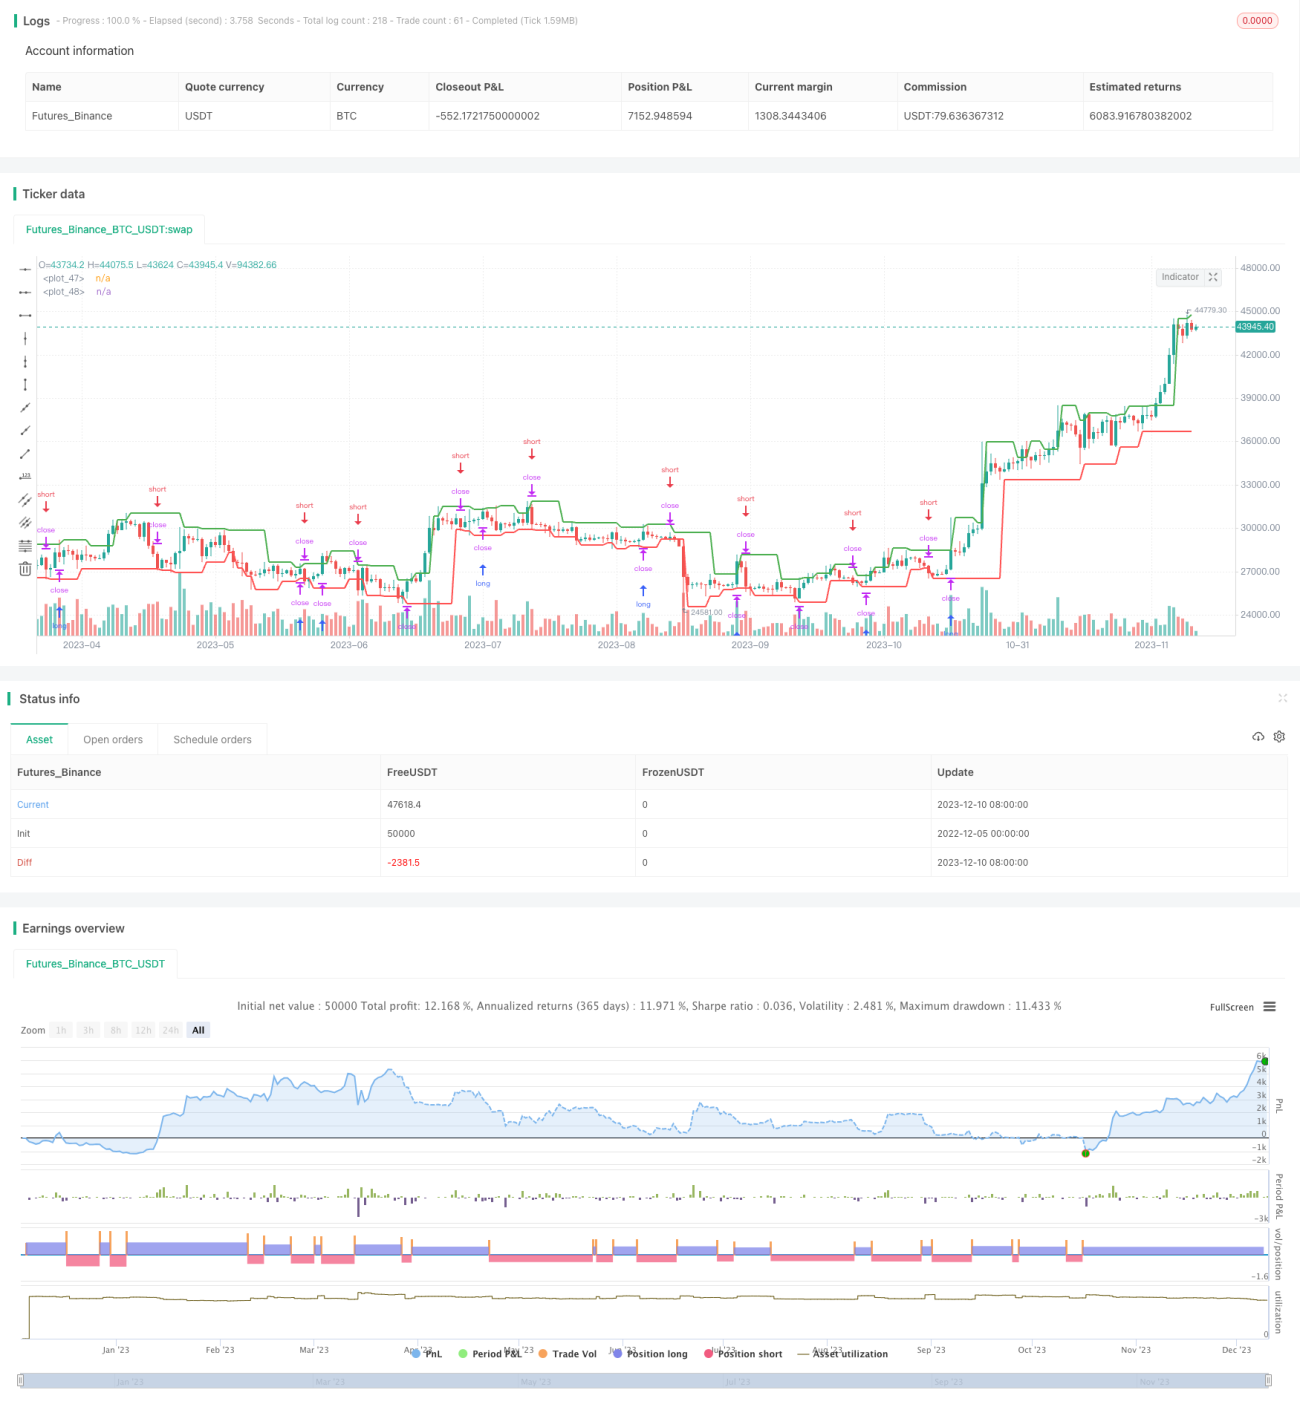
Es una estrategia de trading cuantitativa que utiliza los puntos de apoyo como señal de entrada. Calcula los puntos de apoyo al alza y los puntos de apoyo a la baja, y inicia posiciones largas o cortas una vez que el precio rompe estos puntos de apoyo.
Principio de estrategia
La estrategia se basa principalmente en la teoría de la inversión de puntos de apoyo. Primero calcula los puntos de apoyo de la raíz N de la línea K a la izquierda y la raíz M de la línea K a la derecha. Luego, monitorea en tiempo real si los precios rompen estos puntos de apoyo.
Cuando el precio rompe el punto de soporte de subida, indica que la fuerza de ranchang ya no es suficiente para continuar elevando el precio, en este caso, el shorting puede obtener mejores ganancias. Cuando el precio rompe el punto de soporte de caída, indica que la fuerza de la manga se ha agotado, en este caso, hacer más puede obtener mejores ganancias.
En concreto, la estrategia calcula los puntos de apoyo al alza y los puntos de apoyo al descenso mediante las funciones ta.pivothigh y ta.pivotlow. Luego se compara si el precio más alto actual ha roto el punto de apoyo al alza y el precio más bajo si ha roto el punto de apoyo al descenso. Si lo hace, se inicia la estrategia de hacer más deuda correspondiente.
Además, la estrategia también utiliza un stop loss para controlar el riesgo. En concreto, cuando el precio rompe el punto de soporte, el pedido se realiza de inmediato, mientras que el stop loss se establece en el otro lado del punto de soporte, de modo que se evite al máximo la expansión de las pérdidas causadas por el single fallido.
Análisis de las ventajas
Esta estrategia basada en la inversión de puntos de apoyo tiene las siguientes ventajas:
- Las señales de cambio de punto de apoyo son más confiables y tienen una mayor tasa de éxito.
- El riesgo está controlado y el stop loss está razonable.
- Es fácil de implementar, el código es sencillo
- Adaptable a diferentes variedades, mejor flexibilidad
Análisis de riesgos
La estrategia también tiene algunos riesgos a tener en cuenta:
- Los puntos de apoyo pueden fallar y causar señales erróneas
- El retorno puede ocurrir después de la ruptura del punto de apoyo, lo que provoca que el deterioro se active
- La frecuencia de las transacciones puede ser alta y los gastos de transacción son un costo oculto.
- El efecto tiene que ver con la variedad y la configuración de los parámetros, y necesita ajustes
Para reducir el riesgo, se pueden considerar los siguientes puntos:
- Optimización de la cantidad de líneas K en el lado izquierdo y derecho para asegurar que el cálculo de puntos de apoyo sea más fiable
- Ampliar el rango de pérdidas adecuadamente para evitar pérdidas excesivas
- Establezca objetivos de ganancias mínimas para reducir el número de transacciones repetidas
- Prueba diferentes variedades y parámetros para encontrar la configuración óptima
Dirección de optimización
La estrategia tiene espacio para ser optimizada aún más:
- La fiabilidad de la ruptura de los puntos de apoyo en combinación con otros indicadores
- El aumento de los modelos de aprendizaje automático para determinar las tendencias de precios
- El uso de datos de alta frecuencia para mejorar la sensibilidad de las señales de transacción
- Agrega un módulo de administración de posiciones para ajustar las posiciones de forma dinámica según las condiciones
- Acceda al módulo de cuentas detalladas para calcular los gastos reales de las transacciones
Estas optimizaciones pueden mejorar la probabilidad de éxito, la rentabilidad y la estabilidad de las estrategias.
Resumir
En resumen, se trata de una estrategia de comercio cuantitativa basada en la teoría de la inversión de puntos de apoyo. Utiliza el punto de apoyo de ruptura de precios como señal de negociación, mientras que el uso de mecanismos de control de pérdidas. La estrategia es fácil de implementar, de amplia aplicación, es una estrategia de comercio cuantitativa práctica.
/*backtest
start: 2022-12-05 00:00:00
end: 2023-12-11 00:00:00
period: 1d
basePeriod: 1h
exchanges: [{"eid":"Futures_Binance","currency":"BTC_USDT"}]
*/

//@version=5
strategy('Weekly Returns with Benchmark', overlay=true,
     default_qty_type=strategy.percent_of_equity, default_qty_value=25,
commission_type=strategy.commission.percent, commission_value=0.1)- 1