Estrategia de trading multi-temporal basada en el indicador de volatilidad y el indicador estocástico
Descripción general
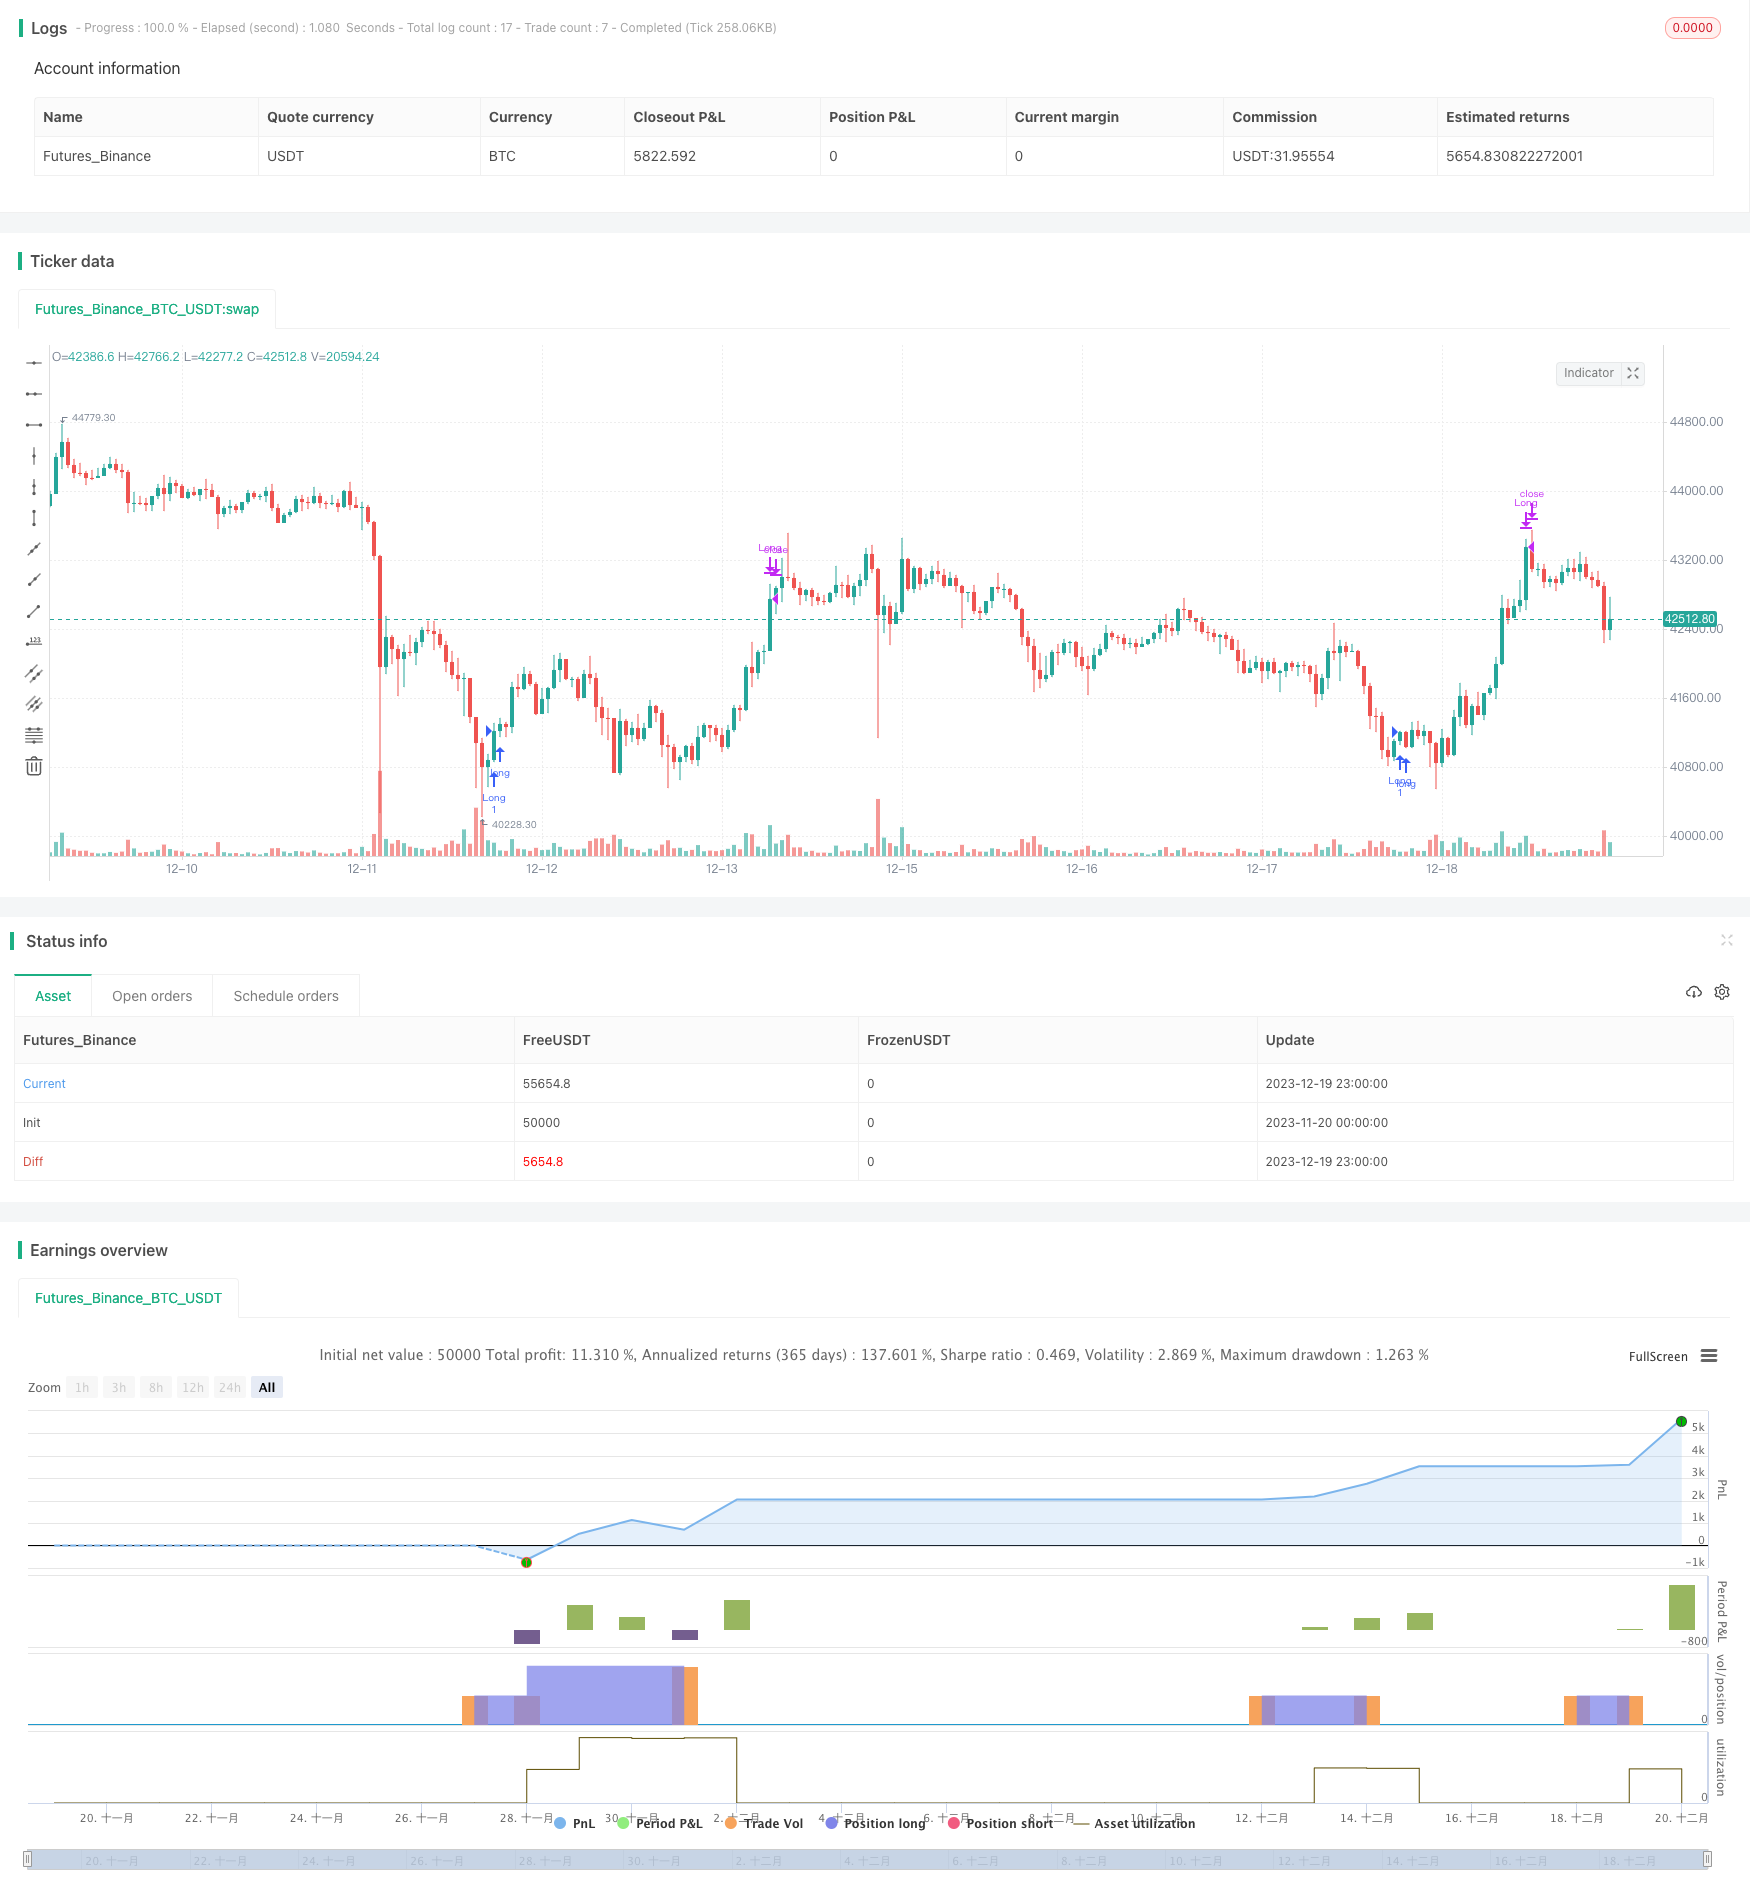
Esta estrategia combina el indicador de volatilidad VIX y el indicador aleatorio RSI para lograr una posición de equilibrio de pérdidas muy eficiente para comprar y comprar en exceso y vender en exceso a través de una combinación de indicadores de diferentes períodos de tiempo. La estrategia tiene un gran espacio de optimización y puede adaptarse a diferentes entornos de mercado.
Principio de estrategia
Calcula el índice de fluctuación VIX: toma el precio más alto y el precio más bajo de los últimos 20 días para calcular la fluctuación. Cuando la fluctuación es superior a la vía, indica pánico en el mercado; cuando es inferior a la vía, indica complacencia en el mercado.
Calcula el indicador aleatorio del RSI: toma los alzas y bajas de los últimos 14 días y calcula que cuando el RSI está por encima de 70 es zona de sobrecompra y por debajo de 30 es zona de sobreventa.
La fusión de dos indicadores, hacer más cuando la volatilidad es superior a la raíz o el porcentaje máximo; hacer una posición plana cuando el RSI es superior a 70.
Ventajas estratégicas
- La integración de varios indicadores para juzgar el momento del mercado.
- Los diferentes indicadores de los períodos de tiempo se verifican entre sí para mejorar la precisión de las decisiones.
- Los parámetros de ajuste se pueden optimizar para adaptarse a las diferentes variedades de transacciones.
Análisis de riesgos
- La configuración incorrecta de los parámetros puede causar falsas señales repetidas.
- Un solo indicador de posiciones cerradas puede pasar por alto las inversiones de precios.
Recomendaciones para la optimización
- Añadir más indicadores de verificación, como la línea media, la banda de Bryn y otros para determinar el tiempo de ingreso.
- Añadir más indicadores de posición cerrada, como la inversión de la forma de la línea K.
Resumir
Esta estrategia utiliza el indicador VIX para determinar el momento y el nivel de riesgo del mercado, y se combina con el indicador RSI para filtrar los puntos de negociación desfavorables de sobreventa y sobreventa, para comprar y detener los pérdidas en el momento más eficiente. La estrategia tiene un gran espacio de optimización y se puede adaptar a un entorno de mercado más amplio.
/*backtest
start: 2023-11-20 00:00:00
end: 2023-12-20 00:00:00
period: 1h
basePeriod: 15m
exchanges: [{"eid":"Futures_Binance","currency":"BTC_USDT"}]
*/

//@version=5
// This source code is subject to the terms of the Mozilla Public License 2.0 at https://mozilla.org/MPL/2.0/
// © timj

strategy('Vix FIX / StochRSI Strategy', overlay=true, pyramiding=9, margin_long=100, margin_short=100)

Stochlength = input.int(14, minval=1, title="lookback length of Stochastic")
StochOverBought = input.int(80, title="Stochastic overbought condition")
StochOverSold = input.int(20, title="Stochastic oversold condition")
smoothK = input(3, title="smoothing of Stochastic %K ")
smoothD = input(3, title="moving average of Stochastic %K")
k = ta.sma(ta.stoch(close, high, low, Stochlength), smoothK)
d = ta.sma(k, smoothD)

///////////// RSI
RSIlength = input.int( 14, minval=1 , title="lookback length of RSI")
RSIOverBought = input.int( 70  , title="RSI overbought condition")
RSIOverSold = input.int( 30  , title="RSI oversold condition")
RSIprice = close
vrsi = ta.rsi(RSIprice, RSIlength)

///////////// Double strategy: RSI strategy + Stochastic strategy

pd = input(22, title="LookBack Period Standard Deviation High")
bbl = input(20, title="Bolinger Band Length")
mult = input.float(2.0    , minval=1, maxval=5, title="Bollinger Band Standard Devaition Up")
lb = input(50  , title="Look Back Period Percentile High")
ph = input(.85, title="Highest Percentile - 0.90=90%, 0.95=95%, 0.99=99%")
new = input(false, title="-------Text Plots Below Use Original Criteria-------" )
sbc = input(false, title="Show Text Plot if WVF WAS True and IS Now False")
sbcc = input(false, title="Show Text Plot if WVF IS True")
new2 = input(false, title="-------Text Plots Below Use FILTERED Criteria-------" )
sbcFilt = input(true, title="Show Text Plot For Filtered Entry")
sbcAggr = input(true, title="Show Text Plot For AGGRESSIVE Filtered Entry")
ltLB = input.float(40, minval=25, maxval=99, title="Long-Term Look Back Current Bar Has To Close Below This Value OR Medium Term--Default=40")
mtLB = input.float(14, minval=10, maxval=20, title="Medium-Term Look Back Current Bar Has To Close Below This Value OR Long Term--Default=14")
str = input.int(3, minval=1, maxval=9, title="Entry Price Action Strength--Close > X Bars Back---Default=3")
//Alerts Instructions and Options Below...Inputs Tab
new4 = input(false, title="-------------------------Turn On/Off ALERTS Below---------------------" )
new5 = input(false, title="----To Activate Alerts You HAVE To Check The Boxes Below For Any Alert Criteria You Want----")
sa1 = input(false, title="Show Alert WVF = True?")
sa2 = input(false, title="Show Alert WVF Was True Now False?")
sa3 = input(false, title="Show Alert WVF Filtered?")
sa4 = input(false, title="Show Alert WVF AGGRESSIVE Filter?")

//Williams Vix Fix Formula
wvf = ((ta.highest(close, pd)-low)/(ta.highest(close, pd)))*100
sDev = mult * ta.stdev(wvf, bbl)
midLine = ta.sma(wvf, bbl)
lowerBand = midLine - sDev
upperBand = midLine + sDev
rangeHigh = (ta.highest(wvf, lb)) * ph

//Filtered Bar Criteria
upRange = low > low[1] and close > high[1]
upRange_Aggr = close > close[1] and close > open[1]
//Filtered Criteria
filtered = ((wvf[1] >= upperBand[1] or wvf[1] >= rangeHigh[1]) and (wvf < upperBand and wvf < rangeHigh))
filtered_Aggr = (wvf[1] >= upperBand[1] or wvf[1] >= rangeHigh[1]) and not (wvf < upperBand and wvf < rangeHigh)

//Alerts Criteria
alert1 = wvf >= upperBand or wvf >= rangeHigh ? 1 : 0
alert2 = (wvf[1] >= upperBand[1] or wvf[1] >= rangeHigh[1]) and (wvf < upperBand and wvf < rangeHigh) ? 1 : 0
alert3 = upRange and close > close[str] and (close < close[ltLB] or close < close[mtLB]) and filtered ? 1 : 0
alert4 = upRange_Aggr and close > close[str] and (close < close[ltLB] or close < close[mtLB]) and filtered_Aggr ? 1 : 0

//Coloring Criteria of Williams Vix Fix
col = wvf >= upperBand or wvf >= rangeHigh ? color.lime : color.gray

isOverBought = (ta.crossover(k,d) and k > StochOverBought) ? 1 : 0
isOverBoughtv2 = k > StochOverBought ? 1 : 0
filteredAlert = alert3 ? 1 : 0
aggressiveAlert = alert4 ? 1 : 0


if (filteredAlert or aggressiveAlert)
    strategy.entry("Long", strategy.long)

if (isOverBought)
    strategy.close("Long")