Estrategia de stop loss dinámico con banda de Bohr ATR
Descripción general
Esta estrategia combina el uso de la banda de Bol y el indicador de la amplitud real promedio (ATR) para formar una estrategia de negociación de ruptura con función de parada de seguimiento. Se emite una señal de negociación cuando el precio cruza la banda de Bol de un estándar especificado para subir o bajar. Al mismo tiempo, se utiliza la indicación de ATR para calcular el punto de pérdida y el punto de parada para controlar el porcentaje de pérdidas.
Principio de estrategia
En el primer paso, se calcula la línea media, la línea superior y la línea inferior. La línea media es el promedio móvil simple del precio (SMA) y la línea superior y inferior es el número entero de veces de la diferencia estándar del precio. Cuando el precio se rompe hacia arriba desde la línea inferior, se hace más; cuando se rompe hacia abajo desde la línea superior, se hace más.
El segundo paso es calcular el indicador ATR. El indicador ATR refleja la amplitud de fluctuación promedio de los precios. Establecer el punto de parada de la posición larga y el punto de parada de la posición corta de acuerdo con el valor de ATR.
El tercer paso es usar un filtro de tiempo para negociar solo en los períodos de tiempo indicados, evitando así las fuertes fluctuaciones de los eventos de noticias importantes.
Cuarto paso, el mecanismo de trailing stop. Ajuste el stop loss en tiempo real según la posición más reciente del ATR, para bloquear más ganancias.
Análisis de las ventajas
El índice de la Bolsa refleja el centro de los precios de manera más efectiva que una simple media móvil.
El ATR Stop Loss permite controlar el porcentaje de ganancias y pérdidas por unidad y así controlar el riesgo de manera efectiva.
El trailing stop se ajusta automáticamente a las fluctuaciones del mercado para bloquear más ganancias.
La estrategia es rica en parámetros y se puede personalizar la combinación.
Análisis de riesgos
La corrección de los grandes movimientos de la bolsa es propensa a sufrir pérdidas menores en varias ocasiones.
La ruptura de la Franja de Bor se ha invertido y podría fracasar.
Las transacciones nocturnas y las noticias importantes son peligrosas y deben evitarse.
Respuesta:
- Cumplir estrictamente con los principios de gestión de riesgos y controlar las pérdidas individuales;
- El objetivo es optimizar los parámetros y aumentar la tasa de éxito.
- Utilice filtros de tiempo para evitar las horas de mayor riesgo.
Dirección de optimización
- Prueba de la configuración de optimización de diferentes combinaciones de parámetros
- Aumentar los indicadores de calor como el OBV cuando se selecciona
- Aumentar la optimización de módulos de aprendizaje automático
Resumir
La estrategia utiliza un conjunto de indicadores de banda de Bol para determinar el centro de la tendencia y la dirección de la ruptura, el indicador ATR para calcular el stop loss para garantizar el beneficio y el beneficio, y el stop loss para bloquear las ganancias. La estrategia tiene la ventaja de ser altamente personalizable, controlada por el riesgo y adecuada para el comercio de líneas cortas en el día a día.
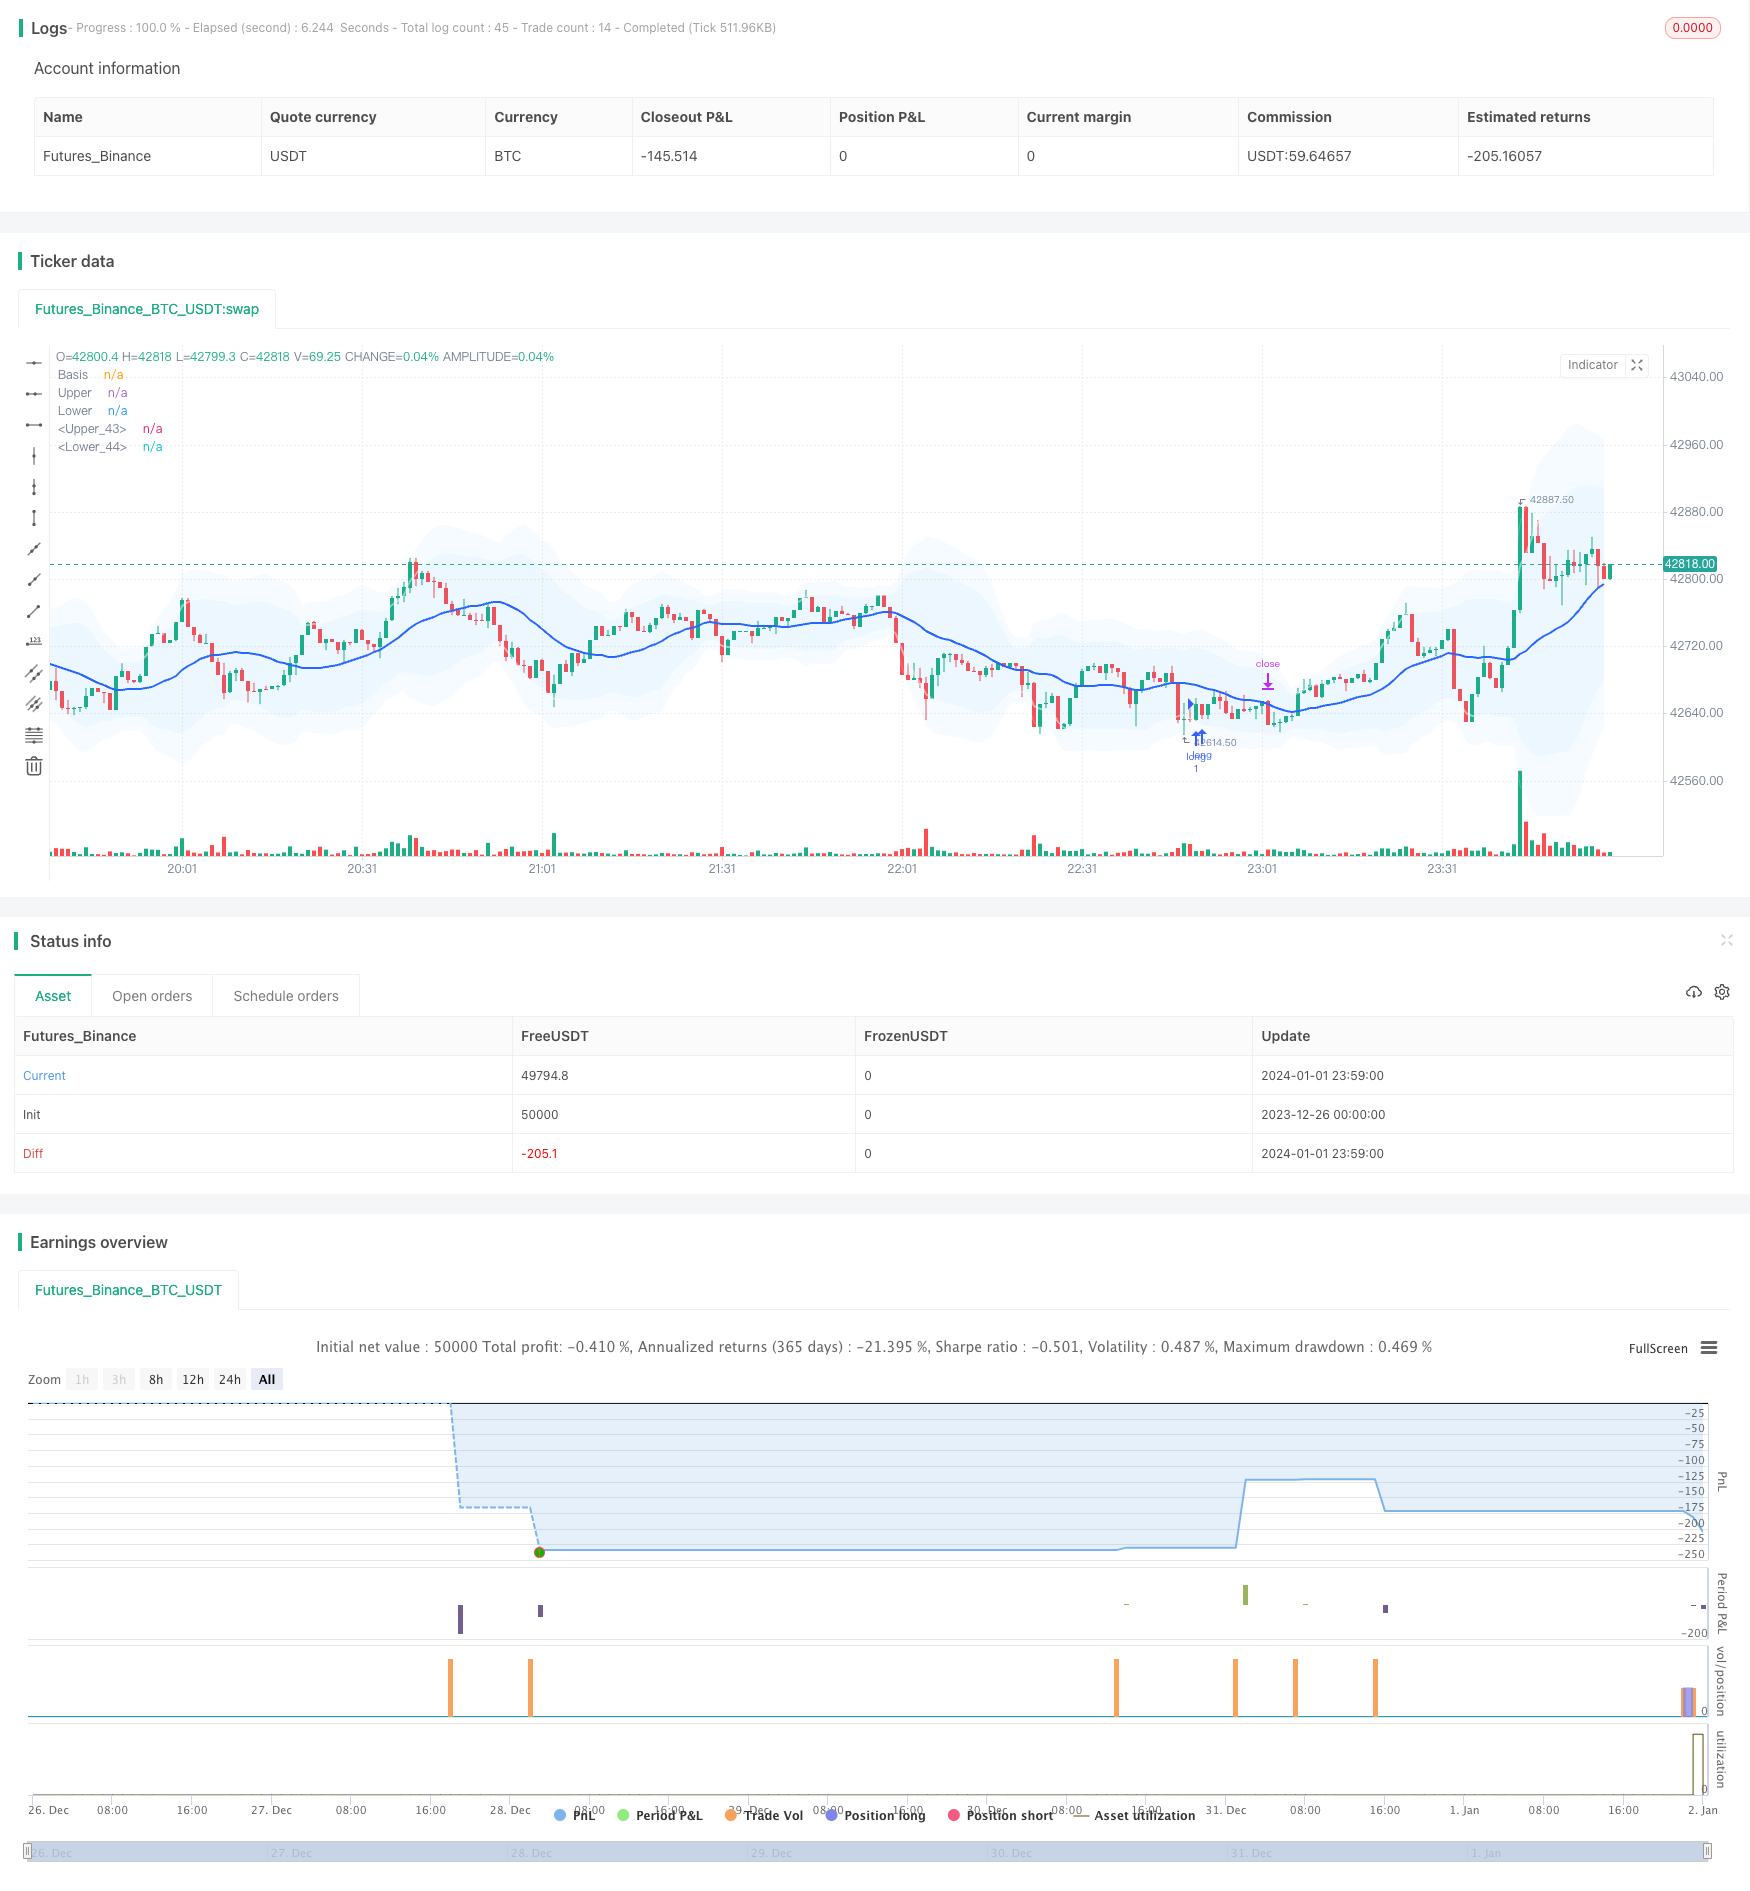
/*backtest
start: 2023-12-26 00:00:00
end: 2024-01-02 00:00:00
period: 1m
basePeriod: 1m
exchanges: [{"eid":"Futures_Binance","currency":"BTC_USDT"}]
*/

// This source code is subject to the terms of the Mozilla Public License 2.0 at https://mozilla.org/MPL/2.0/
// © sadeq_haddadi

//@version=5

strategy('Bollinger Bands + ATR / trail- V2', overlay=true ) // Interactive Brokers rate)


//date and time
startDate   = input(title="Start Date", defval=timestamp("01 Aug 2023 00:00 +0000"), tooltip="Date & time to begin analysis",group = 'Time Filter')
endDate     = input(title="End Date", defval=timestamp("1 Jan 2099 00:00 +0000"), tooltip="Date & time to stop analysis")
timeSession = input(title="Time Session To Analyze", defval="0300-1700", tooltip="Time session to analyze")
inSession(sess) => true

// indicators

length = input.int(20, minval=1,group = 'Bollinger Band')
maType = input.string("SMA", "Basis MA Type", options = ["SMA", "EMA", "SMMA (RMA)", "WMA", "VWMA"])
src = input(close, title="Source")
mult1 = input.float(2.0, minval=0.001, maxval=50, title="StdDev1")
mult2 = input.float(3.0, minval=0.001, maxval=50, title="StdDev2")

ma(source, length, _type) =>
    switch _type
        "SMA" => ta.sma(source, length)
        "EMA" => ta.ema(source, length)
        "SMMA (RMA)" => ta.rma(source, length)
        "WMA" => ta.wma(source, length)
        "VWMA" => ta.vwma(source, length)

basis = ma(src, length, maType)
dev1 = mult1 * ta.stdev(src, length)
dev2 = mult2 * ta.stdev(src, length)
upper1 = basis + dev1
lower1 = basis - dev1
upper2 = basis + dev2
lower2 = basis - dev2
offset = input.int(0, "Offset", minval = -500, maxval = 500)
plot(basis, "Basis", color=#2962FF, offset = offset,linewidth=2)
p1 = plot(upper1, "Upper", color=color.new(color.white,50), offset = offset,linewidth=2)
p2 = plot(lower1, "Lower", color=color.new(color.white,50), offset = offset,linewidth=2)
p3 = plot(upper2, "Upper", color=color.new(color.white,80), offset = offset,linewidth=1)
p4 = plot(lower2, "Lower", color=color.new(color.white,80), offset = offset,linewidth=1)

fill(p1, p2, title = "Background", color=color.rgb(33, 150, 243, 95))
fill(p3, p4, title = "Background", color=color.rgb(33, 150, 243, 95))

show_crosses = input(false, "Show Cross the Bands?")

plotshape(show_crosses and ta.crossover(close, upper2)  ? src : na, "S", style = shape.triangledown, location =location.abovebar, color = color.yellow, size = size.tiny)
plotshape(show_crosses and ta.crossunder(low, lower2) ? src : na ,"L", style = shape.triangleup, location =  location.belowbar, color = color.purple, size = size.tiny)

second_entry = input(true, "Show second deviation entry point?")

//atr

length_ATR = input.int(title="Length", defval=5, minval=1,group = 'ATR')
smoothing = input.string(title="Smoothing", defval="RMA", options=["RMA", "SMA", "EMA", "WMA"])
m = input.float(1, "Multiplier")
src1 = input(high)
src2 = input(low)
pline = input.bool(title = 'show ATR lines ?', defval=false)


ma_function(source, length_ATR) =>
	if smoothing == "RMA"
		ta.rma(source, length_ATR)
	else
		if smoothing == "SMA"
			ta.sma(source, length_ATR)
		else
			if smoothing == "EMA"
				ta.ema(source, length_ATR)
			else
				ta.wma(source, length_ATR)

a = ma_function(ta.tr(true), length_ATR) * m
x = ma_function(ta.tr(true), length_ATR) * m + src1
x2 = src2 - ma_function(ta.tr(true), length_ATR) * m

PP1 = plot(pline ? x :na , title = "ATR Short Stop Loss", color= color.new(color.red,20) )
PP2 = plot(pline ? x2:na , title = "ATR Long Stop Loss",  color=color.new(color.green,20) )

Tp_to_Sl = input.float(1.5, "TP/SL")
candle_size =  input.float(10, "candle/pip")
distance_source =  input.float(1.5, "distance to midline/pip")
//strategy

buyCondition = low[2] < lower1 and  ta.crossover(close[1], lower1)  and strategy.position_size == 0 and (close[1] - open[1]) < candle_size * 0.0001 and close > open and ( basis - close) > distance_source * 0.0001

sellCondition = high[2] > upper1 and ta.crossunder(close[1], upper1)  and strategy.position_size == 0 and (open[1] - close[1]) < candle_size * 0.0001 and close < open  and (close - basis) > distance_source * 0.0001
//
buyCondition2 = low[2] < lower2 and  ta.crossover(close[1], lower2)  and (close[1] - open[1]) < candle_size * 0.0001 and close > open and ( basis - close) > distance_source * 0.0001
sellCondition2 = high[2] > upper2 and ta.crossunder(close[1], upper2)   and (open[1] - close[1]) < candle_size * 0.0001 and close < open  and (close - basis) > distance_source * 0.0001

plotshape(second_entry and  sellCondition2 ? src : na, "S", style = shape.triangledown, location =location.abovebar, color = color.rgb(241, 153, 177), size = size.tiny)
plotshape(second_entry and buyCondition2 ? src : na ,"L", style = shape.triangleup, location =  location.belowbar, color = color.rgb(177, 230, 168), size = size.tiny)
//
since_buy  =ta.barssince(buyCondition)
since_sell =ta.barssince(sellCondition)
entry_price = ta.valuewhen(buyCondition or sellCondition, src, 0)

sl_long = ta.valuewhen(buyCondition, x2[1], 0)
sl_short = ta.valuewhen(sellCondition, x[1], 0)
buyprofit = entry_price + (Tp_to_Sl*( entry_price - sl_long))
sellprofit= entry_price + (Tp_to_Sl*( entry_price - sl_short))

//alert_massage = "new strategy position is {{strategy.position_size}}"
//prof = ta.crossover(high,upper1)
//buyexit=ta.valuewhen(prof,upper1,0)

if buyCondition and inSession(timeSession)

    strategy.entry( id = "long", direction = strategy.long , alert_message='Open Long Position' )

if sellCondition and inSession(timeSession)

    strategy.entry(id= "short", direction = strategy.short, alert_message='Open Short Position')

//trail-stop loss
use_trailing = input.bool(title = 'use trailing stop loss?', defval=true)
pricestop_long=0.00
pricestop_short=100000.00
if (strategy.position_size > 0)

    if use_trailing == false
        pricestop_long := sl_long
    else
        pricestop_long := math.max (x2, pricestop_long[1]) //trail - long

if (strategy.position_size < 0)

    if use_trailing == false
        pricestop_short := sl_short
    else
        pricestop_short := math.min (x, pricestop_short[1])  // trail - short

if strategy.position_size > 0

    strategy.exit(id = 'close', limit =  buyprofit , stop = pricestop_long  )

if strategy.position_size < 0

    strategy.exit(id = 'close', limit = sellprofit  , stop = pricestop_short  )

alertcondition(buyCondition or sellCondition, 'Enter_position')