Estrategia de trading multi-temporal basada en RSI y medias móviles
Descripción general
Esta estrategia combina el indicador aleatorio RSI, el promedio móvil SMA y el promedio móvil ponderado WMA para buscar señales de compra y venta. Al mismo tiempo, determina la dirección de la tendencia en los marcos de tiempo de 5 minutos y 1 hora.
Principio de estrategia
La estrategia primero calcula el promedio móvil ponderado de 144 ciclos WMA y el promedio móvil simple de 5 ciclos SMA en los dos marcos de tiempo de 1 hora y 5 minutos respectivamente. Sólo cuando el SMA de 5 minutos está por encima del WMA, se considera que es un mercado con más cabezales. Luego, la estrategia calcula el indicador pluriespacial del RSI, así como las correspondientes líneas K y D. Cuando la línea K pasa por debajo de la línea D de la zona de sobreventa, se genera una señal de venta; cuando la línea K pasa por la línea D de la zona de sobreventa, se genera una señal de compra.
Análisis de las ventajas
Es una estrategia de seguimiento de tendencias muy eficaz. Combina dos tendencias de evaluación de marcos de tiempo al mismo tiempo, lo que reduce las señales erróneas de manera muy efectiva. Además, combina filtros de varios indicadores, incluidos el RSI, SMA y WMA, para que la señal sea más confiable.
Análisis de riesgos
El mayor riesgo de esta estrategia es el error en el juicio de la tendencia. En los puntos de inflexión, los promedios a corto y largo plazo pueden subir o bajar al mismo tiempo, lo que genera una señal errónea. Además, en los momentos de oscilación, el RSI también puede generar más señales de negociación confusas.
Dirección de optimización
La estrategia puede ser optimizada en los siguientes aspectos: 1) Prueba de diferentes longitudes de SMA, WMA y RSI para encontrar la mejor combinación de parámetros 2) Añadir otros indicadores de juicio, como MACD, líneas de Brin para verificar la fiabilidad de la señal 3) Optimización de las estrategias de stop loss, prueba de métodos como el stop loss de proporción fija, el stop loss de punto de deslizamiento de saldo y el stop loss de seguimiento 4) Adherirse al módulo de gestión de fondos para controlar el tamaño de la inversión individual y la apertura de riesgo general 5) Aumentar los algoritmos de aprendizaje automático para encontrar los parámetros de mejor rendimiento a través de una gran cantidad de pruebas de retroalimentación
Resumir
La estrategia aprovecha las ventajas de los promedios móviles y los indicadores aleatorios para crear un sistema de seguimiento de tendencias más fiable. A través de la verificación de varios marcos de tiempo e indicadores, puede capturar con éxito la dirección de las tendencias de la línea media y larga. Al mismo tiempo, la configuración de stop loss también le permite soportar un cierto grado de conmoción del mercado.
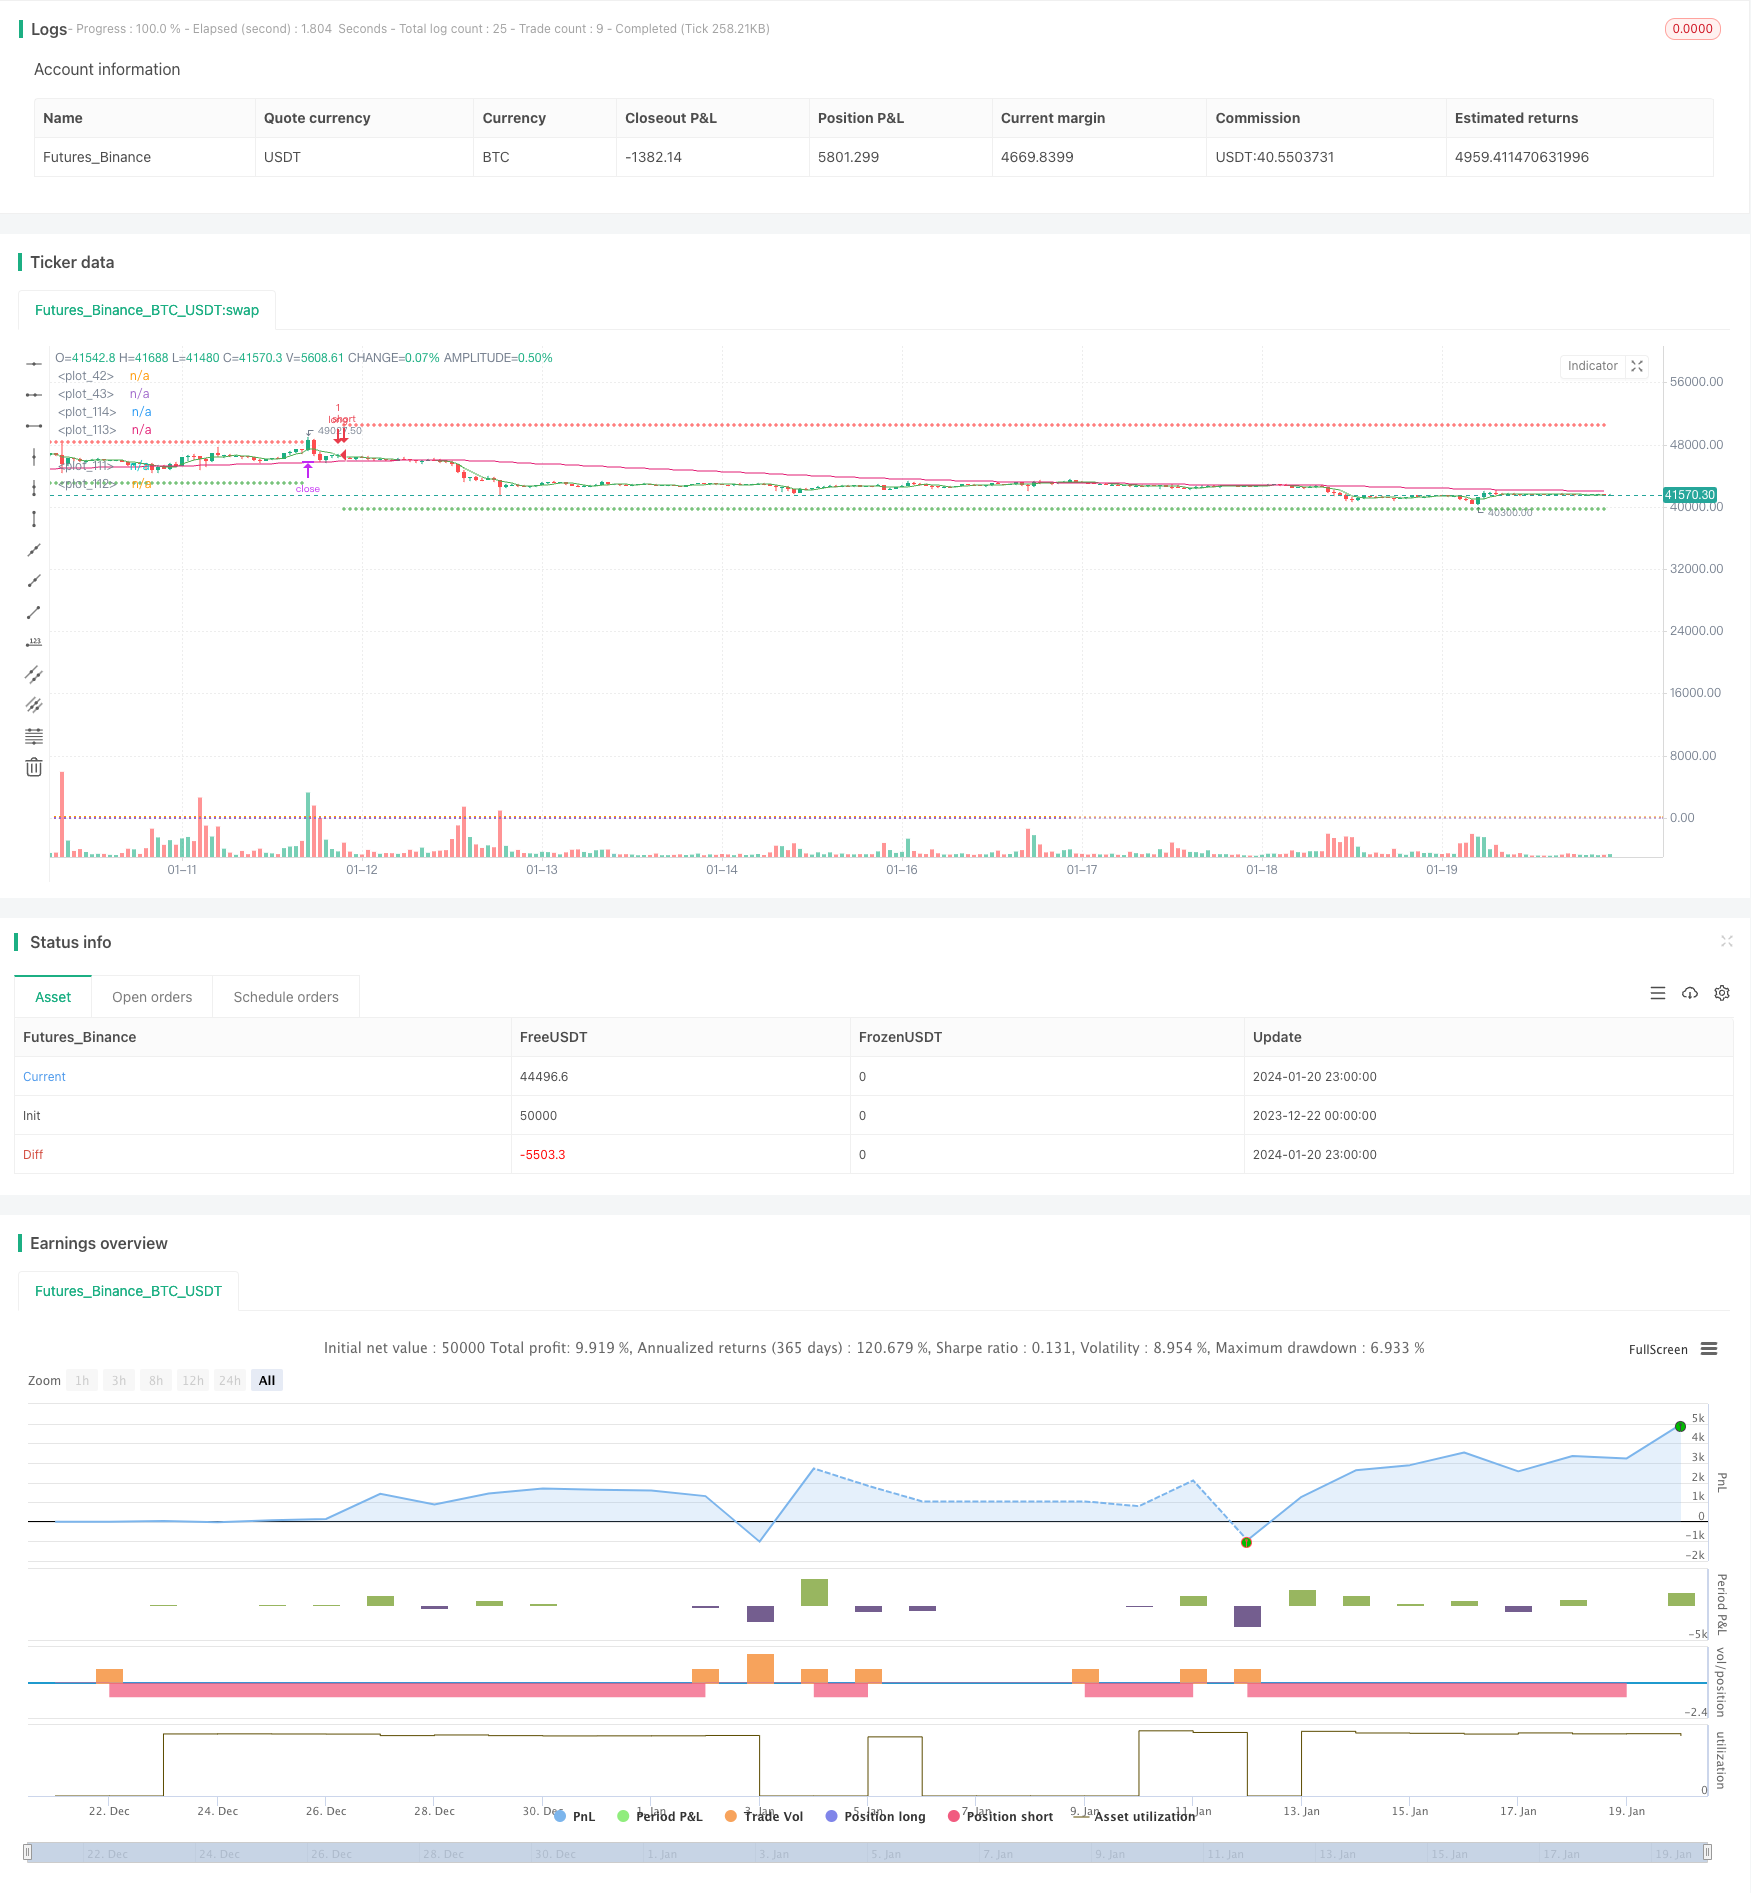
/*backtest
start: 2023-12-22 00:00:00
end: 2024-01-21 00:00:00
period: 1h
basePeriod: 15m
exchanges: [{"eid":"Futures_Binance","currency":"BTC_USDT"}]
*/

// This source code is subject to the terms of the Mozilla Public License 2.0 at https://mozilla.org/MPL/2.0/
// © bufirolas

// Works well with a wide stop with 20 bars lookback
// for the SL level and a 2:1 reward ratio Take Profit .
// These parameters can be modified in the Inputs section of the strategy panel.

// "an entry signal it's a cross down or up on
// the stochastics. if you're in a downtrend
// on the hourly time frame you
// must also be in a downtrend on the five
// minute so the five period has to be below the 144
// as long as the five period is still trading below
// the 144 period on both the hourly and the five minutes
// we are looking for these short signals crosses down
// in the overbought region of the stochastic. Viceversa for longs"

//@version=4
strategy("Stoch + WMA + SMA strat", overlay=true)

//SL & TP Inputs
i_SL=input(true, title="Use Swing Lo/Hi Stop Loss & Take Profit")
i_SwingLookback=input(20, title="Swing Lo/Hi Lookback")
i_SLExpander=input(defval=10, step=1, title="SL Expander")
i_TPExpander=input(defval=30, step=1, title="TP Expander")
i_reverse=input(false, title="Reverse Trades")
i_TStop =input(false, title="Use Trailing Stop")

//Strategy Inputs
src4 = input(close, title="RSI Source")
stochOS=input(defval=20, step=5, title="Stochastics Oversold Level")
stochOB=input(defval=80, step=5, title="Stochastics Overbought Level")

//Stoch rsi Calculations
smoothK = input(3, minval=1)
smoothD = input(3, minval=1)
lengthRSI = input(14, minval=1)
lengthStoch = input(14, minval=1)
rsi1 = rsi(src4, lengthRSI)
k = sma(stoch(rsi1, rsi1, rsi1, lengthStoch), smoothK)
d = sma(k, smoothD)
h0 = hline(80, linestyle=hline.style_dotted)
h1 = hline(20, linestyle=hline.style_dotted)

//MA
wmalen=input(defval=144, title="WMA Length")
WMA = security(syminfo.tickerid, "60", wma(close, wmalen))
SMA = security(syminfo.tickerid, "60", sma(close, 5))
minWMA = wma(close, wmalen)
minSMA = sma(close, 5)

//Entry Logic
stobuy = crossover(k, d) and k < stochOS
stosell = crossunder(k, d) and k > stochOB
mabuy = minSMA > minWMA
daymabuy = SMA > WMA

//SL & TP Calculations
SwingLow=lowest(i_SwingLookback)
SwingHigh=highest(i_SwingLookback)
bought=strategy.position_size != strategy.position_size[1]
LSL=valuewhen(bought, SwingLow, 0)-((valuewhen(bought, atr(14), 0)/5)*i_SLExpander)
SSL=valuewhen(bought, SwingHigh, 0)+((valuewhen(bought, atr(14), 0)/5)*i_SLExpander)
lTP=(strategy.position_avg_price + (strategy.position_avg_price-(valuewhen(bought, SwingLow, 0)))+((valuewhen(bought, atr(14), 0)/5)*i_TPExpander))
sTP=(strategy.position_avg_price - (valuewhen(bought, SwingHigh, 0) - strategy.position_avg_price))-((valuewhen(bought, atr(14), 0)/5)*i_TPExpander)
islong=strategy.position_size > 0
isshort=strategy.position_size < 0

//TrailingStop
dif=(valuewhen(strategy.position_size>0 and strategy.position_size[1]<=0, high,0))
 -strategy.position_avg_price
trailOffset     = strategy.position_avg_price - LSL
var tstop = float(na)
if strategy.position_size > 0
    tstop := high- trailOffset - dif
    if tstop<tstop[1]
        tstop:=tstop[1]
else
    tstop := na
StrailOffset     = SSL - strategy.position_avg_price
var Ststop = float(na)
Sdif=strategy.position_avg_price-(valuewhen(strategy.position_size<0
 and strategy.position_size[1]>=0, low,0))
if strategy.position_size < 0
    Ststop := low+ StrailOffset + Sdif
    if Ststop>Ststop[1]
        Ststop:=Ststop[1]
else
    Ststop := na

//Stop Selector
SL= islong ? LSL : isshort ? SSL : na
if i_TStop
    SL:= islong ? tstop : isshort ? Ststop : na
TP= islong ? lTP : isshort ? sTP : na


//Entries
if stobuy and mabuy and daymabuy
    strategy.entry("long", long=not i_reverse?true:false)
if stosell and not mabuy and not daymabuy
    strategy.entry("short", long=not i_reverse?false:true)


//Exit
if i_SL
    strategy.exit("longexit", "long", stop=SL, limit=TP)
    strategy.exit("shortexit", "short", stop=SL, limit=TP)

//Plots
plot(i_SL ? SL : na, color=color.red, style=plot.style_cross)
plot(i_SL ? TP : na, color=color.green, style=plot.style_cross)
plot(minWMA)
plot(minSMA, color=color.green)