Estrategia de comercio dinámico en red

Descripción general
Este script de Pine proporciona un potente marco para la prueba y optimización de estrategias de trading de la red en TradingView. Utiliza la función strategy.orders () para automatizar la negociación de la red y realizar el feedback.
Principio de estrategia
El principio central de esta estrategia se basa en una red dinámica. La red se compone de una serie de niveles de precios para guiar las posiciones de compra y venta. Cuando el precio rompe cada nivel, se desencadena la acción de negociación.
Concretamente, en la caída, se entra en más compras en los niveles de soporte. En la tensión, se cierra en los niveles de resistencia clave para obtener ganancias. El ancho y la proporción de la rejilla se ajustan según la volatilidad del mercado y los patrones de negociación.
A través de este mecanismo de comercio automático de la red, se puede aprovechar eficazmente las oportunidades de fluctuación bidireccional del mercado y obtener ganancias positivas estables.
Análisis de las ventajas
La estrategia tiene las siguientes ventajas:
-
Cuadrícula dinámicaSe puede personalizar el tipo de cuadrícula, los parámetros de ancho y la resolución de los puntos de apoyo para adaptarse a la dinámica del mercado.
-
Las estrategias de compra inteligente: Ofrece múltiples formas de compra, puede ajustar la cantidad de compra y controlar la ubicación de la compra.
-
La venta estratégicaOptimización de las ganancias mediante la configuración de la cantidad, el control de la posición de venta y el establecimiento de condiciones de stop loss.
-
Las transacciones de energíaSe puede elegir entre transacciones en efectivo y en garantía para satisfacer diferentes preferencias de transacción.
-
Alta capacidad de personalizaciónSe pueden ajustar los parámetros de capital inicial, tasa de arrendamiento, tasa de garantía para optimizar.
-
El panel informáticoEn la página web de la empresa, se puede encontrar un resumen de las principales tendencias de la industria de la información.
Análisis de riesgos
A pesar de las potentes funciones de esta estrategia, hay ciertos riesgos a tener en cuenta cuando se usa en el mundo real:
-
Limites de la detecciónEl resultado de las acciones de la empresa no es un pronóstico de los resultados futuros, y los beneficios no son una garantía.
-
Las fluctuaciones del mercadoEl precio puede cambiar de forma inesperada, lo que afecta a la estrategia.
-
Los problemas de las bolsasEl fallo en el sistema de la bolsa puede causar fracasos en los pedidos, retrasos en la ejecución, etc.
-
Fallo en el sistemaLos sistemas utilizados para generar órdenes, comunicar y recibir resultados pueden fallar, interrumpiendo el proceso de transacción.
-
El retraso en el tiempoEl tiempo de retraso en las transacciones en el disco duro puede causar resultados anormales.
Se requiere un conocimiento adecuado de estos riesgos, operar con cautela y ajustar las estrategias adecuadamente para realizar transacciones algorítmicas seguras.
Dirección de optimización
La estrategia puede seguir mejorando en los siguientes aspectos:
-
Incorporar la lógica de stop loss para reducir las pérdidas de los mercados extremos.
-
El ajuste dinámico de los parámetros de la red, combinado con algoritmos de aprendizaje automático.
-
Introducir indicadores cuantitativos para identificar tendencias y precios clave y mejorar la calidad de la toma de decisiones.
-
Aumentar el módulo de control de riesgo para evitar el riesgo de cobro de las transacciones de garantías.
-
Introducción de análisis a través de ciclos de tiempo para mejorar la eficiencia del tiempo de las decisiones comerciales.
Estas optimizaciones harán que las estrategias sean más eficaces en la retroalimentación y en el disco.
Resumir
El script Pine proporciona un marco sólido para probar y optimizar las estrategias de la red. Aunque es potente, la ejecución en el disco tiene un ligero retraso. Si se tiene suficiente cuidado y se hace una buena evaluación de riesgos, la estrategia se convertirá en una herramienta eficaz para realizar operaciones de red automatizadas y ayudarlo a obtener ganancias estables en los mercados financieros.
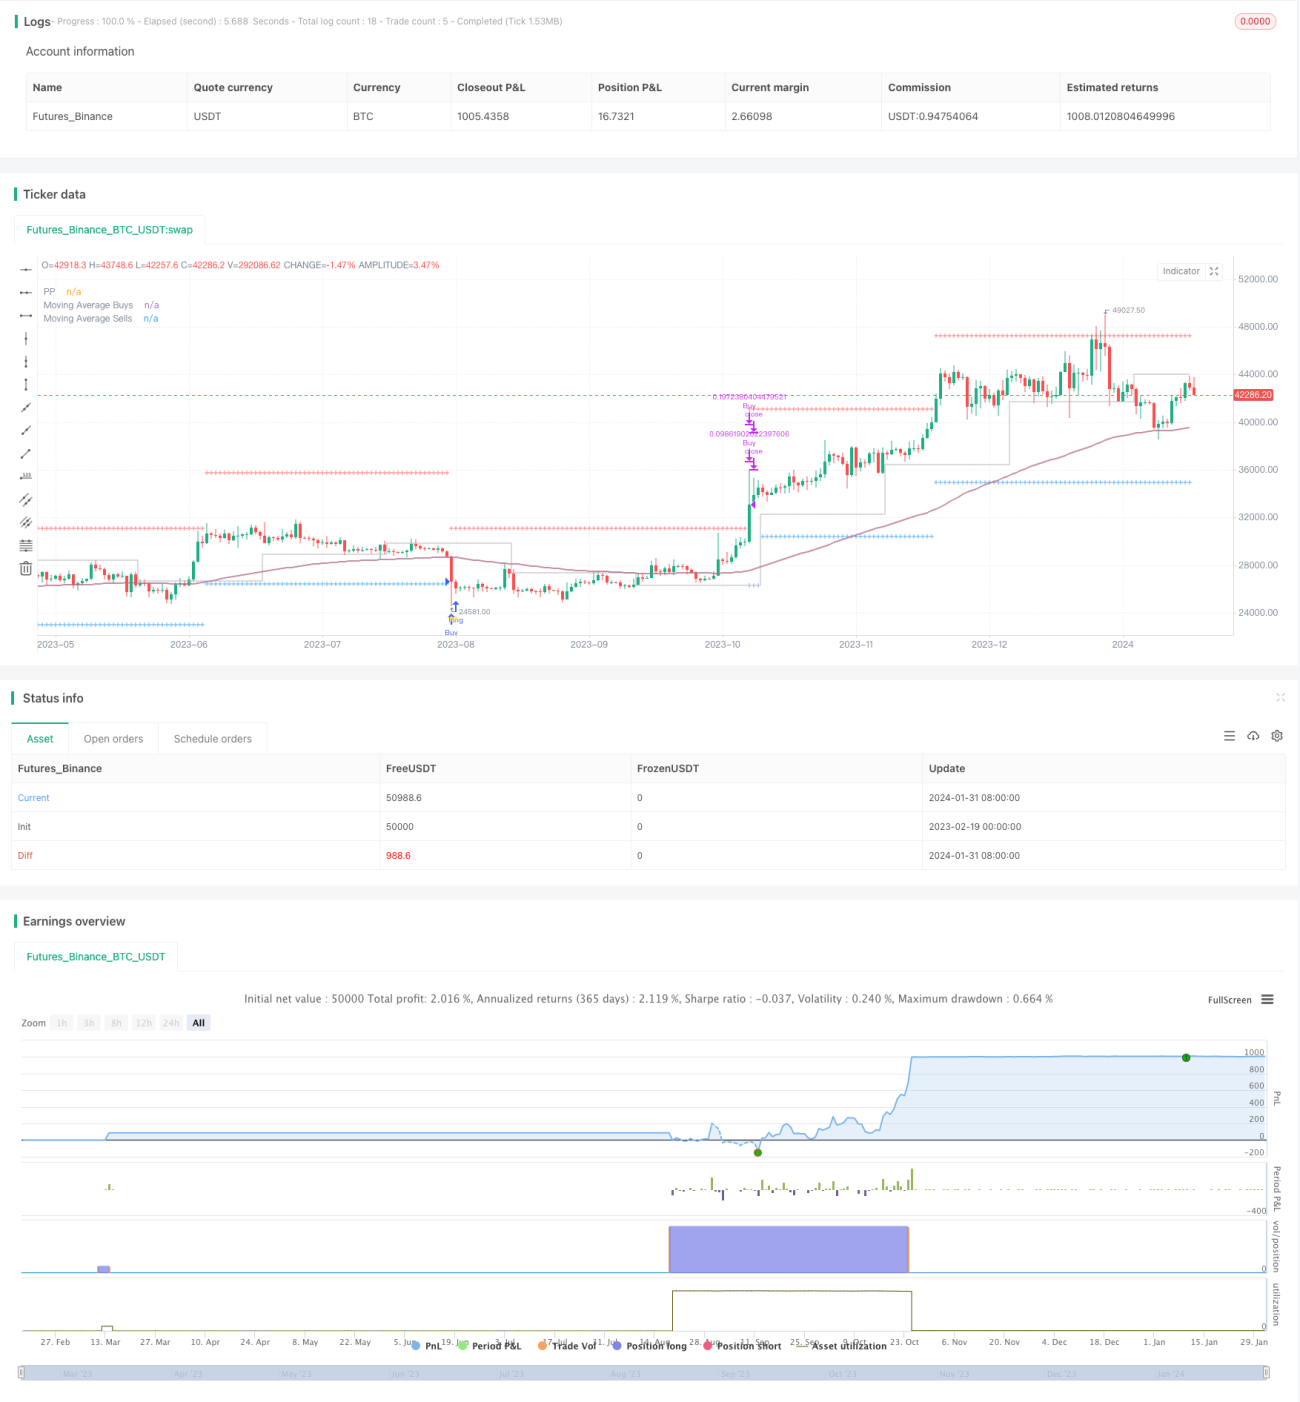
/*backtest
start: 2023-02-19 00:00:00
end: 2024-02-01 05:20:00
period: 1d
basePeriod: 1h
exchanges: [{"eid":"Futures_Binance","currency":"BTC_USDT"}]
*/

// This source code is subject to the terms of the Mozilla Public License 2.0 at https://mozilla.org/MPL/2.0/
// © AssassinsGrid

// Embark on an automated grid-based trading journey with this Pine script tailored for backtesting in TradingView using strategy.orders().- 1