Stratégie de suivi de tendance de 5 minutes basée sur un croisement EMA rapide et lent

Aperçu
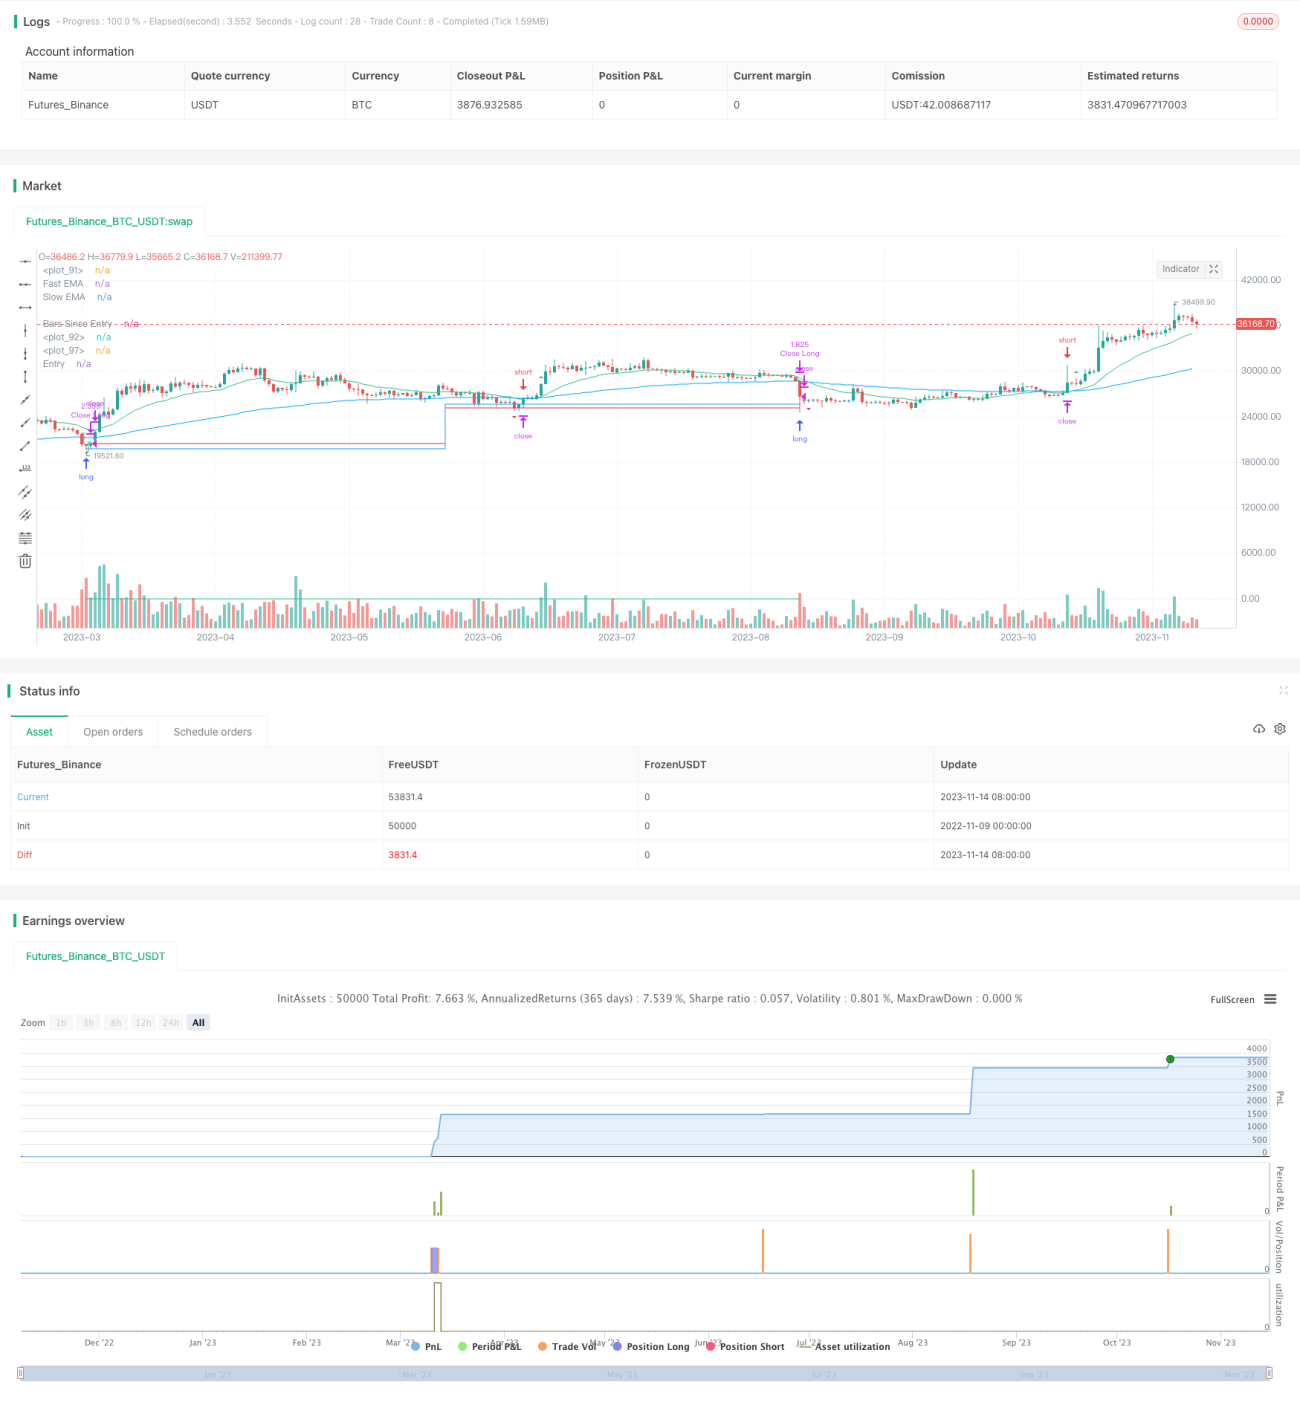
Cette stratégie est basée sur un système de croisement EMA rapide sur une période de 5 minutes, combinant un ordre de prix limité et un suivi automatique de la capture de la tendance. Cette stratégie s'applique à la négociation de tendances à courte ligne moyenne, en utilisant un filtre EMA pour déterminer la direction de la tendance globale, puis en combinant un croisement EMA rapide pour localiser un moment d'entrée spécifique. Son avantage est d'être précis dans la détermination de la tendance et de suivre efficacement la tendance.
Principe de stratégie
- Utilisez l'EMA rapide et l'EMA lente, faites plus lorsque vous portez l'EMA lente sur l'EMA rapide et videz-le lorsque vous le portez
- Utilisez le filtre macro EMA pour faire plus que le prix au-dessus de l'EMA, et moins que le prix en dessous de l'EMA pour éviter les fausses ruptures
- Utilisez un prix limite à l'entrée pour s'assurer que les prix atteignent la position souhaitée.
- Utilisez le suivi dynamique des arrêts de perte après entrée, verrouillage des bénéfices, arrêt des pertes après sortie
Plus précisément:
- Calculer l'EMA rapide en fonction de la longueur de l'EMA rapide et de l'EMA lente
- Si le filtre EMA est activé, vous ne pouvez faire plus que lorsque le prix est supérieur à l'EMA et vous pouvez faire moins que lorsque le prix est inférieur à l'EMA
- Faire plus lorsque l'EMA rapide traverse l'EMA lente; faire moins lorsque l'EMA rapide traverse l'EMA lente
- Limite inférieure pour les billets multiples et limite supérieure pour les billets vides
- Suivi des arrêts de suivi après l'entrée, suivi, arrêt et arrêt des pertes en fonction des prix les plus élevés en cours d'exécution
C'est la logique de base de cette stratégie.
Avantages stratégiques
- Utilisez l'EMA pour déterminer la direction de la tendance globale et éviter les transactions à l'envers
- Les EMA, combinés à des quotas, peuvent empêcher les cours de baisse
- Le suivi dynamique des pertes permet de bien localiser les bénéfices
- Le risque est maîtrisé, chaque stop loss est fixé à environ 2%
- Les retraits sont plus faibles et les tendances sont mieux captées.
- Les stratégies sont simples, claires, faciles à comprendre et à optimiser
Risque stratégique
- Il y a un certain risque de fausse rupture de tendance, qui pourrait être bloquée.
- Une mauvaise configuration de l'EMA peut entraîner une tendance manquée
- Le paramètre d'arrêt est trop grand et peut être bloqué au-delà de la plage de fluctuation normale.
- Le suivi des pertes est trop radical et pourrait entraîner une sortie anticipée
- Les paramètres d'arrêt et de freinage sont déraisonnables et risquent de manquer une situation plus importante.
La réponse:
- Optimiser les paramètres EMA pour trouver la meilleure longueur de cycle
- Laissez la marge de freinage suffisamment large pour éviter des freinages trop fréquents
- Réglage prudent du point de départ et de l'amplitude de suivi des pertes
- Tester différents ratios de stop-loss pour trouver le paramètre optimal
Orientation de l'optimisation de la stratégie
- Optimiser les paramètres du cycle EMA pour trouver la meilleure combinaison de paramètres
- Essayez différents types d'EMA, comme une moyenne mobile pondérée
- Test d'autres indicateurs comme le MACD pour voir si cela peut améliorer l'efficacité
- Essayez de filtrer l'EMA dans une période plus avancée
- Optimiser la fourchette de prix d'entrée
- Optimisation des points et des proportions de l'arrêt de perte
- Essayez des méthodes plus sophistiquées de suivi des pertes
- Ajouter un indicateur de tendance pour juger de la force de la tendance
- Envisagez d'ajouter d'autres filtres pour éviter de nouvelles fausses percées
Résumer
Cette stratégie est une stratégie très adaptée pour la négociation de courts courts courts courts courts courts courts courts courts courts courts courts courts courts courts courts courts courts courts courts courts courts courts courts courts courts courts courts courts courts courts courts courts courts courts courts courts courts courts courts courts courts courts courts courts courts courts courts courts courts courts courts courts courts courts courts courts courts courts courts courts courts courts courts courts courts courts courts courts courts courts courts courts courts courts courts courts courts courts courts courts courts courts courts courts courts courts courts courts courts courts courts courts courts courts courts courts courts courts courts courts courts courts courts courts courts courts courts courts courts courts courts courts courts courts courts courts courts courts courts courts
- 1