Stratégie de croisement à double moyenne mobile

Aperçu
Cette stratégie est basée sur une double ligne moyenne croisée. Elle combine une moyenne mobile simple rapide (SMA) et une moyenne mobile pondérée lente (VWMA) pour former des signaux d'achat et de vente.
Un signal de vente est généré lorsque le SMA rapide traverse le VWMA lent vers le haut.
Principe de stratégie
La logique de base de cette stratégie est basée sur le système de double équilibre. Plus précisément, elle utilise simultanément les indicateurs techniques suivants:
- Moyenne mobile simple (SMA): moyenne arithmétique des prix de clôture des n derniers jours, qui reflète la moyenne des prix des périodes les plus récentes.
- Moyenne mobile pondérée ((VWMA): moyenne pondérée des prix de clôture des n derniers jours, donnant plus de poids aux prix récents et permettant une réponse plus rapide aux variations de prix.
Les paramètres SMA rapides dans les doubles moyennes sont plus courts, ce qui permet de répondre rapidement aux variations de prix; les paramètres VWMA lents sont plus longs et ont un effet d'entraînement. Lorsque les tendances à court et à long terme évoluent dans la même direction, les SMA rapides à la hausse traversent les VWMA lentes pour générer un signal d'achat.
La stratégie met en place un mécanisme de stop-loss. Lorsque le prix se déplace dans une direction défavorable, le stop-loss est effectué à temps pour contrôler le risque.
Analyse des avantages
- Répondre rapidement et suivre les changements de tendances du marché
- Les retraits sont contrôlés et les mécanismes de stop-loss contrôlent les risques.
- Une mise en œuvre simple, intuitive et facile à comprendre
- Optimisation en ajustant les paramètres pour s'adapter à différentes conditions de marché
Analyse des risques
- La stratégie de double équilibre est susceptible de générer de faux signaux sur les marchés à capitaux multiples.
- Il faut choisir les bons paramètres, les mauvais réglages peuvent entraîner des pertes
- Il peut arriver que des maux de tête causés par des événements soudains sur le Markt
Les méthodes de contrôle des risques:
- Le filtrage des tendances est utilisé pour confirmer
- Optimiser les paramètres
- Une stratégie de prévention des pertes et un contrôle raisonnable des pertes individuelles
Direction d'optimisation
Cette stratégie peut être optimisée dans les domaines suivants:
- Confirmation en combinaison avec d'autres indicateurs techniques, tels que RSI, ligne de Brin, etc., pour améliorer l'exactitude du signal
- Optimiser la longueur des paramètres de la ligne moyenne, en ajustant les paramètres en fonction des périodes
- Les transactions sont effectuées à des points d'entrée et de sortie d'une grande quantité d'énergie, associées à des indicateurs de volume de transactions.
- Adaptation des paramètres en fonction des résultats de la rétro-mesure et sélection des paramètres optimaux
- Utilisation de stop loss dynamique pour ajuster les points de stop loss en fonction de la volatilité du marché
Résumer
Cette stratégie est une stratégie de suivi de tendance très pratique dans son ensemble. Elle utilise un simple croisement de doubles moyennes intuitives pour générer des signaux de négociation et capte efficacement les changements de tendance du marché grâce à une combinaison de moyennes rapides et moyennes lentes. Le mécanisme de stop-loss lui permet également de bien contrôler les risques.
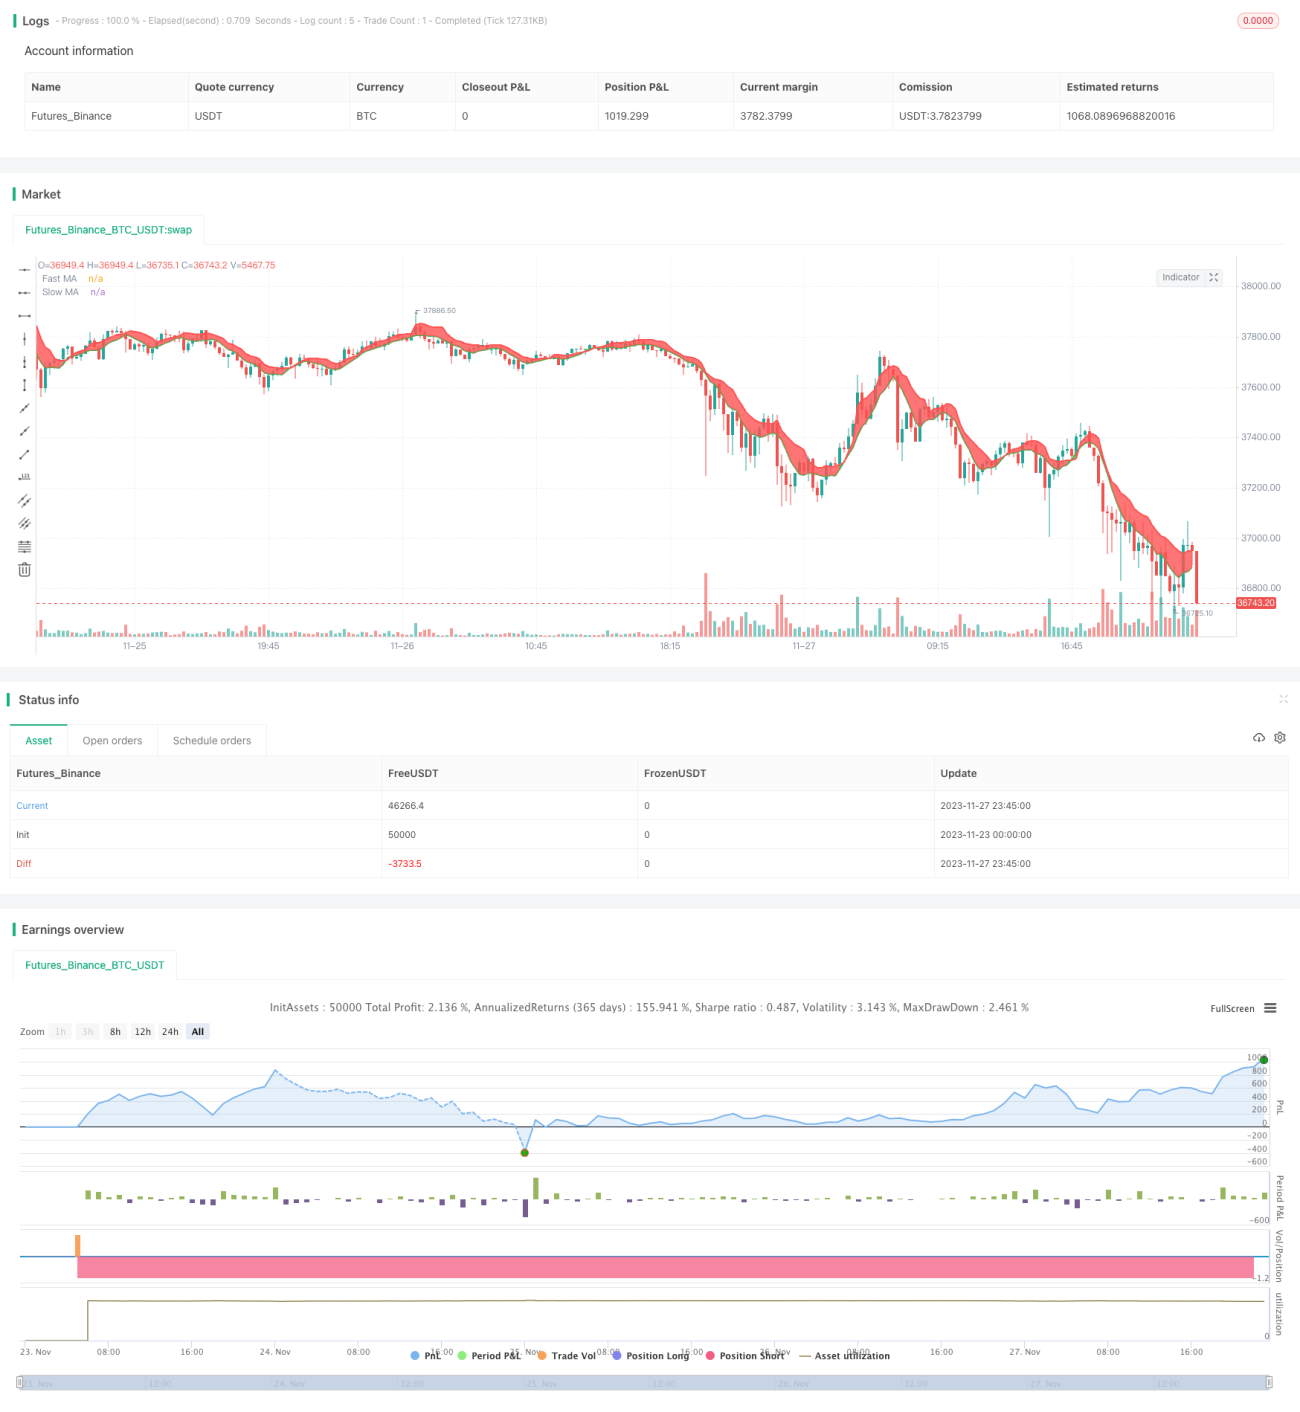
/*backtest
start: 2023-11-23 00:00:00
end: 2023-11-28 00:00:00
period: 15m
basePeriod: 5m
exchanges: [{"eid":"Futures_Binance","currency":"BTC_USDT"}]
*/

//@version=4
//strategy(title="Bitlinc Entry v0.1 VWMA / SMA / MRSI SQQQ 94M", overlay=true, initial_capital=10000, currency='USD')

strategy(title="Bitlinc Entry v0.1 VWMA / SMA / MRSI SQQQ 94M", overlay=true)- 1