Stratégie Triple SuperTrend et Stoch RSI

Aperçu
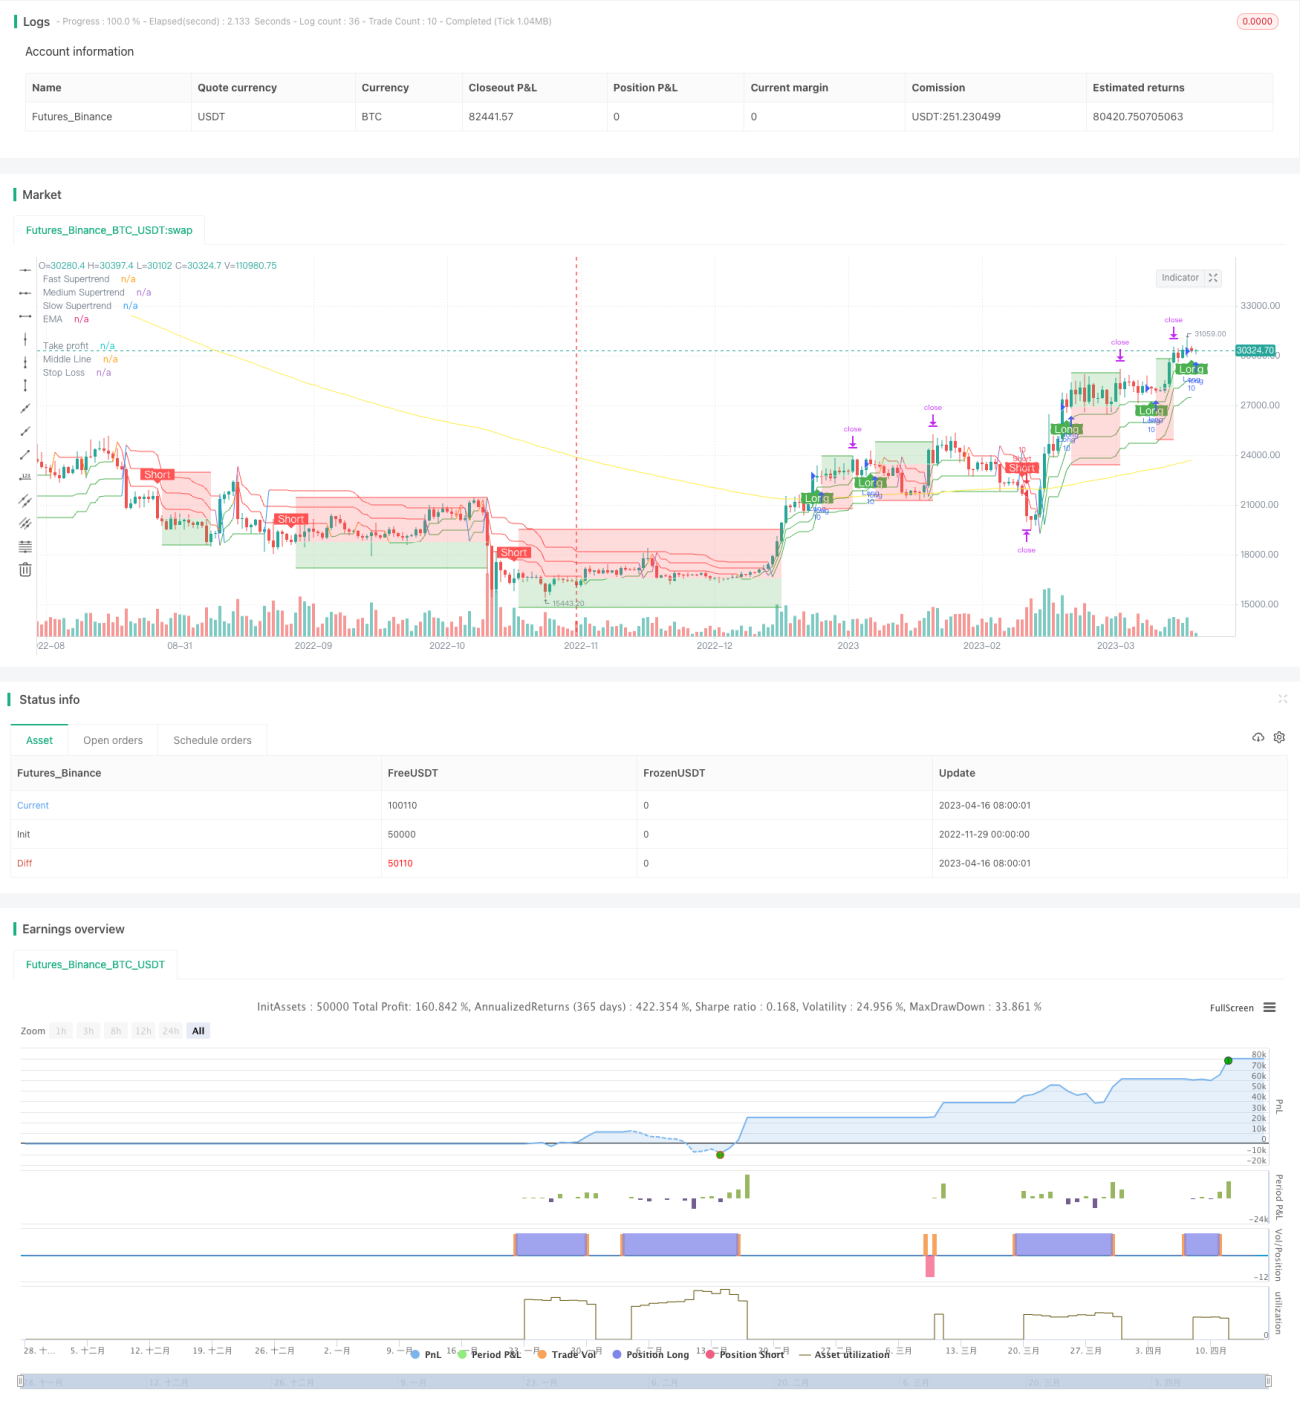
La stratégie Triple SuperTrend et Stoch RSI est une stratégie de trading quantitatif combinant le suivi de tendance sur plusieurs périodes avec des indicateurs de surachat et de survente. Elle utilise trois jeux de paramètres différents de l'indicateur SuperTrend pour évaluer la tendance du marché, et combine les signaux du Stoch RSI (surachat/survente) pour générer des signaux de trading. Concrètement, lorsque les deux SuperTrend les plus rapides émettent simultanément un signal d'achat/vente et que le Stoch RSI confirme ce signal, la stratégie exécute une position longue ou courte correspondante.
Principe de la stratégie
La logique centrale de la stratégie Triple SuperTrend et Stoch RSI consiste à filtrer les signaux de trading en combinant des indicateurs SuperTrend avec différents paramètres et l'indicateur Stoch RSI, afin d'améliorer la qualité des signaux et de réduire le taux de faux signaux.
Premièrement, la stratégie utilise trois groupes de paramètres différents de l'indicateur SuperTrend pour déterminer la tendance principale du marché. Ces trois groupes ont des réglages distincts, avec des horizons temporels allant du plus rapide au plus lent, afin de capturer les changements de tendance à différents niveaux. Lorsque les SuperTrend les plus rapides et les deuxièmes plus rapides émettent simultanément un signal d'achat/vente, nous considérons que ce signal a une certaine fiabilité.
Ensuite, la stratégie introduit l'indicateur Stoch RSI pour déterminer si le signal est en situation de surachat ou de survente excessive. Le Stoch RSI combine les avantages du RSI et du stochastique, permettant d'évaluer efficacement si le marché est en surachat ou survente. Si les signaux des deux SuperTrend les plus rapides concordent avec le signal du Stoch RSI, nous pouvons émettre le signal d'achat/vente final.
Grâce à la combinaison de plusieurs indicateurs et de plusieurs horizons temporels, la stratégie Triple SuperTrend et Stoch RSI parvient à filtrer efficacement le bruit du marché, à améliorer la fiabilité des signaux et à réduire les erreurs de trading.
Avantages de la stratégie
Le principal avantage de la stratégie Triple SuperTrend et Stoch RSI réside dans la combinaison efficace de plusieurs indicateurs et de plusieurs horizons temporels, ce qui apporte les bénéfices suivants :
-
Réduction des faux signaux de trading. La combinaison des trois SuperTrend et du Stoch RSI réduit considérablement le bruit et les faux signaux d'un indicateur unique.
-
Augmentation du ratio de signaux rentables. Bien que la fréquence des signaux diminue, la proportion de signaux rentables augmente nettement.
-
Adaptée aux marchés en tendance. Le filtrage multi-périodes favorise la capture des tendances à moyen et long terme, ce qui convient aux environnements de marché présentant des tendances marquées.
-
Facile à optimiser par réglage des paramètres. Trois indicateurs offrent un espace de possibilités plus vaste pour l'optimisation des paramètres.
-
Paramètres ajustables selon le style personnel. Il est possible de modifier librement les paramètres pour adapter la stratégie à son propre style de trading.
Risques de la stratégie
La stratégie Triple SuperTrend et Stoch RSI comporte également certains risques, principalement dans les domaines suivants :
-
Diminution de la fréquence des signaux. Le mécanisme de filtrage multicouche entraîne une réduction notable de la fréquence des transactions.
-
Risque de manquer certains signaux. La nature prudente de la stratégie peut faire manquer certaines opportunités potentielles.
-
Multi-indicateurs augmentant la dépendance aux paramètres. Plus il y a d'indicateurs et de paramètres, plus l'optimisation de la stratégie devient complexe.
-
Capacité de suivi limitée. La combinaison de plusieurs horizons temporels restreint également la flexibilité de la stratégie pour suivre les tendances.
Face à ces risques, nous pouvons optimiser la stratégie en ajustant les paramètres des indicateurs, en introduisant des indicateurs auxiliaires supplémentaires, etc., afin de contrôler les risques tout en obtenant une meilleure qualité de profit.
Axes d'optimisation de la stratégie
La stratégie Triple SuperTrend et Stoch RSI offre encore des possibilités d'amélioration, principalement dans les directions suivantes :
-
Ajuster les combinaisons de paramètres des indicateurs pour trouver l'appariement optimal. On peut tester davantage de groupes de paramètres pour trouver les paramètres les plus performants.
-
Ajouter des stratégies de stop-loss et take-profit pour contrôler le risque par transaction. Cela peut considérablement améliorer la stabilité de la stratégie.
-
Introduire davantage d'indicateurs de confirmation. Par exemple, utiliser des indicateurs de volume pour une analyse sous plusieurs angles.
-
Ajouter des fonctions d'auto-adaptation. Permettre à la stratégie d'optimiser et d'ajuster automatiquement les paramètres en fonction des changements du marché.
-
Combiner avec des algorithmes d'apprentissage automatique pour la prédiction. Utiliser des algorithmes d'IA pour prédire la précision des signaux des indicateurs.
Grâce à une optimisation continue, la stratégie Triple SuperTrend et Stoch RSI peut devenir une stratégie de trading quantitatif stable et efficace, générant un Alpha notable.
Résumé
La stratégie Triple SuperTrend et Stoch RSI réussit à combiner l'analyse multi-périodes avec le jugement de surachat/survente, créant ainsi une stratégie de trading de suivi de tendance unique. Elle conserve à la fois les avantages du suivi de tendance et du filtrage par indicateurs, réduisant le bruit tout en augmentant la proportion de signaux rentables. Bien que la stratégie comporte encore des risques et des possibilités d'optimisation, sa rentabilité et sa stabilité peuvent être encore améliorées grâce à l'ajustement des paramètres et à l'optimisation. Dans l'ensemble, la stratégie Triple SuperTrend et Stoch RSI offre un choix de stratégie de haute qualité pour la pratique du trading quantitatif.
- 1