Stratégie de maximisation du profit Y
Aperçu
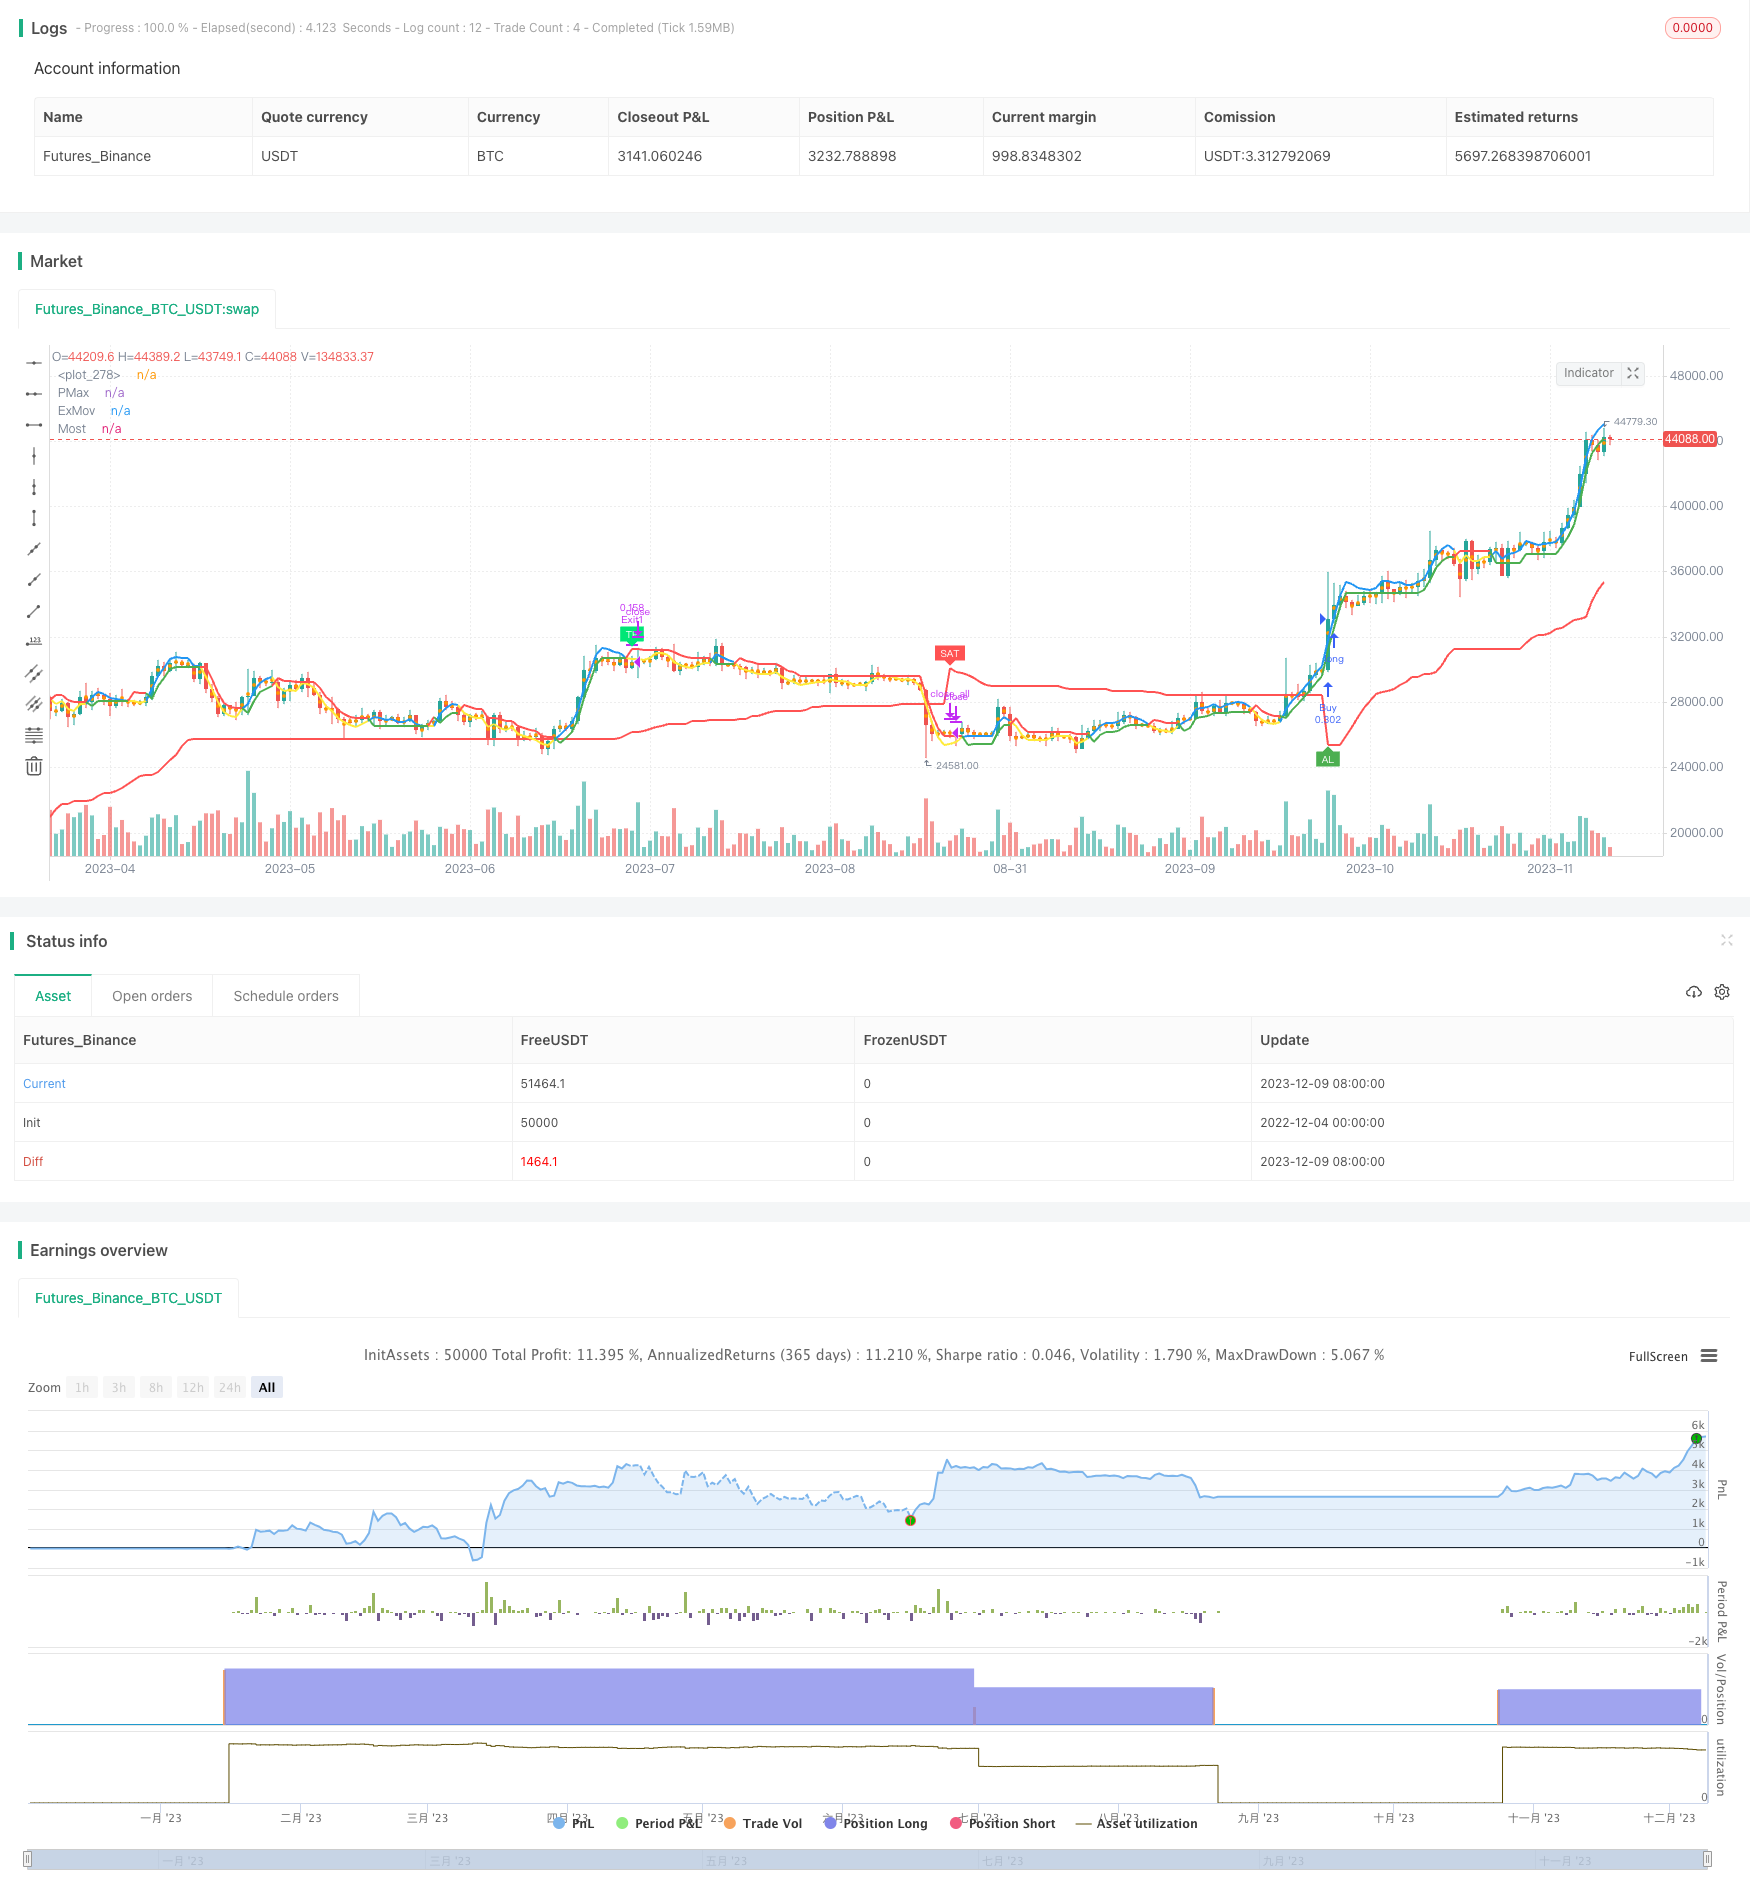
L’idée centrale de cette stratégie est de maximiser la valeur de la traçabilité des arrêts mobiles et d’optimiser l’entrée en jeu avec des filtres et des méthodes de blocage. La forme Y du nom de la stratégie représente la forme croisée de la ligne de signal de la stratégie.
Principe de stratégie
Cette stratégie est principalement basée sur la stratégie de l’explorateur PMax de KivancOzbilgic, avec quelques modifications.
PMax est calculé sur la base de l’ATR et de la moyenne mobile. Générer un signal d’achat lorsque le prix dépasse le PMax.
L’ajout d’indicateurs T3 et de prix comme filtres assure une entrée en hausse.
Définition de l’arrêt: Définition de l’arrêt initial par la stratégie double BAND, puis de l’arrêt et du point d’arrêt ultérieurs par la stratégie souris.
L’indicateur MOST aide à juger les tendances afin de réduire les inversions inutiles.
Analyse des avantages
La stratégie PMax a elle-même l’avantage d’éviter la poursuite de stop-loss élevé, le mécanisme de stop-loss mobile étant plus propice à la réduction de DD.
Les doubles filtres assurent une entrée dans la tendance haussière et évitent les fausses ruptures.
Plusieurs paramètres permettent une plus grande flexibilité dans les gains.
L’indicateur MOST garantit que les opérations ne sont effectuées qu’avec plusieurs têtes et qu’il évite les opérations inversées.
Analyse des risques
Le PMax est lui-même un peu retardé, et il est facile de manquer une première percée.
Un filtre trop réglé peut aussi manquer le point d’entrée en or.
Si la barre d’attente est trop optimiste, les commandes ne seront pas complètement livrées.
Les transactions individuelles sont difficiles dans les variétés à forte volatilité.
Direction d’optimisation
Les indicateurs d’adhésion de la classe MACD peuvent être testés pour déterminer le moment de l’admission.
Il est possible de tester un filtre simplifié en conservant un seul indicateur de filtre.
Il est possible d’ajouter un mécanisme d’arrêt d’ajustement automatique, qui ajuste le point d’arrêt suivant la dynamique de la volatilité et du taux de rendement.
Les tests permettent de faire un vide et d’ajuster la proportion de position en fonction du filtre.
Résumer
L’ensemble de la stratégie prend PMax comme critère d’entrée au cœur et est conçu pour optimiser les filtres à plusieurs niveaux et les méthodes d’arrêt. Un meilleur rendement peut être obtenu dans les variétés en tendance.
/*backtest
start: 2022-12-04 00:00:00
end: 2023-12-10 00:00:00
period: 1d
basePeriod: 1h
exchanges: [{"eid":"Futures_Binance","currency":"BTC_USDT"}]
*/

//@version=4
// This source code is subject to the terms of the Mozilla Public License 2.0 at https://mozilla.org/MPL/2.0/
// © KivancOzbilgic
//developer: @KivancOzbilgic
//author: @enesyetkin

strategy("Y-Profit Maximizer Strategy with Exit Points", shorttitle="Y-PMax Strategy with Exit Points", overlay=true, default_qty_type=strategy.cash, default_qty_value=10000, initial_capital=10000, currency=currency.USD, commission_value=0.1, commission_type=strategy.commission.percent)
baslik1 = input(title="-------------------- PMax Ayarları -------------------", defval=false)
src = input(hl2, title="Kaynak")
Periods = input(title="ATR uzunluğu", type=input.integer, defval=10)
Multiplier = input(title="ATR Multiplier", type=input.float, step=0.1, defval=3.0)
mav = input(title="Moving Average Tipi", defval="VAR", options=["SMA", "EMA", "WMA", "TMA", "VAR", "WWMA", "ZLEMA", "TSF"])
length =input(13, "Moving Average uzunluğu", minval=1)
filtrelemeacik = input(title="Filtreleme Açık/Kapalı", type=input.bool, defval=false)
filtreleme = input(title="Filtreleme T3/Src (T3 Açık/Src Kapalı)", type=input.bool, defval=false)
changeATR= input(title="ATR Hesaplama Yöntemi Değişsin mi?", type=input.bool, defval=true)
showsupport = input(title="Moving Average i göster?", type=input.bool, defval=false)
showsignalsk = input(title="Al Sat Sinyallerini göster?", type=input.bool, defval=true)
showsignalsc = input(title="Fiyat/Pmax kesişim sinyallerini göster?", type=input.bool, defval=false)
highlighting = input(title="Bulut Açık/Kapalı?", type=input.bool, defval=false)


baslik4 = input(title="-------------------- T3 Ayarları --------------------", defval=false)
length1 = input(89, "T3 Uzunluğu")
length2 = input(5, "T3 Filter Uzunluğu")
a1 = input(0.84, "T3 Volume Faktörü")
a13 = 0.84
length12 = input(5, "Fibo T3 Uzunluğu")
a12 = input(0.618, "T3 Fİbo Volume Faktörü")
T31Show = input(title="T3 ü göster?", type=input.bool, defval=false)
T32Show = input(title= "T3 filtreyi göster?", type=input.bool, defval=false)
T3FiboLine = input(false, title="T3 Fibonacci Oranlı Çizgiler?")

shownum = true

baslik7 = input(title="---------------- Take Profit Ayarları --------------", defval=false)

len = input(25, "Yılan Genişliği")
domcycle = input(20, minval=10, title="Dominant Döngü Genişliği")
rapida = input(8, "Hızlı Ort")
lenta = input(26, "Yavaş Ort")
stdv = input(0.8, "Genişlik")
tpfiltre = input(false, title="TP Filtresi avg2/avg4?")
tplevelshow = input(false, title="TP Level ve Exit Level Sayım Açık Kapalı?")
tp1show =  input(false, title="Erken TP Açık Kapalı")

baslik8 = input(title="------------------- MOST Ayarları ------------------", defval=false)

src_most=input(close,"Source")
AP2 = input(defval=8,title="Length",minval=1)
AF2 = input(defval=2,title="Percent",minval=0.1)/100
mav1 = input(title="Moving Average Tipi", defval="ZLEMovA", options=["EMovA","ZLEMovA"])
plotbuysell = input(true, "Al Sat Etiketleri", input.bool)


///T3 1&2
e1 = ema((high + low + 2 * close) / 4, length1)
e2 = ema(e1, length1)
e3 = ema(e2, length1)
e4 = ema(e3, length1)
e5 = ema(e4, length1)
e6 = ema(e5, length1)
c1 = -a1 * a1 * a1
c2 = 3 * a1 * a1 + 3 * a1 * a1 * a1
c3 = -6 * a1 * a1 - 3 * a1 - 3 * a1 * a1 * a1
c4 = 1 + 3 * a1 + a1 * a1 * a1 + 3 * a1 * a1
T3 = c1 * e6 + c2 * e5 + c3 * e4 + c4 * e3

e13 = ema((high + low + 2 * close) / 4, length2)
e23 = ema(e13, length2)
e33 = ema(e23, length2)
e43 = ema(e33, length2)
e53 = ema(e43, length2)
e63 = ema(e53, length2)
c13 = -a13 * a13 * a13
c23 = 3 * a13 * a13 + 3 * a13 * a13 * a13
c33 = -6 * a13 * a13 - 3 * a13 - 3 * a13 * a13 * a13
c43 = 1 + 3 * a13 + a13 * a13 * a13 + 3 * a13 * a13
T33 = c13 * e63 + c23 * e53 + c33 * e43 + c43 * e33


///PMax

atr2 = sma(tr, Periods)
atr= changeATR ? atr(Periods) : atr2
valpha=2/(length+1)
vud1=src>src[1] ? src-src[1] : 0
vdd1=src<src[1] ? src[1]-src : 0
vUD=sum(vud1,9)
vDD=sum(vdd1,9)
vCMO=nz((vUD-vDD)/(vUD+vDD))
VAR=0.0
VAR:=nz(valpha*abs(vCMO)*src)+(1-valpha*abs(vCMO))*nz(VAR[1])
wwalpha = 1/ length
WWMA = 0.0
WWMA := wwalpha*src + (1-wwalpha)*nz(WWMA[1])
zxLag = length/2==round(length/2) ? length/2 : (length - 1) / 2
zxEMAData = (src + (src - src[zxLag]))
ZLEMA = ema(zxEMAData, length)
lrc = linreg(src, length, 0)
lrc1 = linreg(src,length,1)
lrs = (lrc-lrc1)
TSF = linreg(src, length, 0)+lrs
getMA(src, length) =>
    ma = 0.0
    if mav == "SMA"
        ma := sma(src, length)
        ma

    if mav == "EMA"
        ma := ema(src, length)
        ma

    if mav == "WMA"
        ma := wma(src, length)
        ma

    if mav == "TMA"
        ma := sma(sma(src, ceil(length / 2)), floor(length / 2) + 1)
        ma

    if mav == "VAR"
        ma := VAR
        ma

    if mav == "WWMA"
        ma := WWMA
        ma

    if mav == "ZLEMA"
        ma := ZLEMA
        ma

    if mav == "TSF"
        ma := TSF
        ma

    if mav == "T3"
        ma := T3
        ma
    ma

MAvg=getMA(src, length)
longStop = MAvg - Multiplier*atr
longStopPrev = nz(longStop[1], longStop)
longStop := MAvg > longStopPrev ? max(longStop, longStopPrev) : longStop
shortStop = MAvg + Multiplier*atr
shortStopPrev = nz(shortStop[1], shortStop)
shortStop := MAvg < shortStopPrev ? min(shortStop, shortStopPrev) : shortStop
dir = 1
dir := nz(dir[1], dir)
dir := dir == -1 and MAvg > shortStopPrev ? 1 : dir == 1 and MAvg < longStopPrev ? -1 : dir
PMax = dir==1 ? longStop: shortStop


///MOST
zxLag1 = AP2/2==round(AP2/2) ? AP2/2 : (AP2 - 1) / 2
zxEMAData1 = (src_most + (src_most - src_most[zxLag1]))
ZLEMA1 = ema(zxEMAData1, AP2)

getMA1(src, length) =>
    ma1 = 0.0
    if mav1 == "EMovA"
        ma1 := ema(close, 8)
        ma1

    if mav1 == "ZLEMovA"
        ma1 := ZLEMA1
        ma1

Trail1 = getMA1(src, length)
SL2 = Trail1*AF2 // Stop Loss

Trail2 = 0.0
Trail2 := iff(Trail1>nz(Trail2[1],0) and Trail1[1]>nz(Trail2[1],0),max(nz(Trail2[1],0),Trail1-SL2),iff(Trail1<nz(Trail2[1],0) and Trail1[1]<nz(Trail2[1],0),min(nz(Trail2[1],0),Trail1+SL2),iff(Trail1>nz(Trail2[1],0),Trail1-SL2,Trail1+SL2)))

Buy = crossover(Trail1, Trail2)
Sell = crossunder(Trail1, Trail2)
SR=(iff(Trail1 > Trail2 ,1, iff(Trail2 > Trail1,-1,0)))


////T3 TILLSON 1


col1 = T3 > T3[1]
col3 = T3 < T3[1]
col4 = T33 > T33[1]
col5 = T33 < T33[1]
color_1 = col1 ? color.green : col3 ? color.red : color.yellow
color_4 = col4 ? color.green : col5 ? color.red : color.yellow


e12 = ema((high + low + 2 * close) / 4, length12)
e22 = ema(e12, length12)
e32 = ema(e22, length12)
e42 = ema(e32, length12)
e52 = ema(e42, length12)
e62 = ema(e52, length12)
c12 = -a12 * a12 * a12
c22 = 3 * a12 * a12 + 3 * a12 * a12 * a12
c32 = -6 * a12 * a12 - 3 * a12 - 3 * a12 * a12 * a12
c42 = 1 + 3 * a12 + a12 * a12 * a12 + 3 * a12 * a12
T32 = c12 * e62 + c22 * e52 + c32 * e42 + c42 * e32

col12 = T32 > T32[1]
col32 = T32 < T32[1]


///TP BB ve SNAKE

h = ema(high, len)
l = ema(low, len)

hp = h / h[len]
lp = l / l[len]

avg = avg(hp, lp)

havg = ema(highest(avg, len), len)
lavg = ema(lowest(avg, len), len)

avg2 = avg(havg, lavg)
avg3 = avg(havg, avg2)
avg4 = avg(havg, avg3)

dif = havg - avg2

ust = havg + dif
alt = lavg - dif

///BB on MACD

SDev = 0.0
banda_supe = 0.0
banda_inf = 0.0
m_rapida = ema(close,rapida)
m_lenta = ema(close,lenta)
BBMacd = m_rapida - m_lenta
Avg = ema(BBMacd,9)
SDev := stdev(BBMacd,9)
banda_supe := Avg + stdv * SDev
banda_inf := Avg - stdv * SDev

color2 = col12 ? color.blue : col32 ? color.purple : color.yellow

TS1 = plot(Trail1, "ExMov", style=plot.style_line,color=Trail1 > Trail2 ? color.blue : color.yellow, linewidth=2)
TS2 = plot(Trail2, "Most", style=plot.style_line,color=Trail1 > Trail2 ? color.green : color.red, linewidth=2)


tp1 = tpfiltre ? crossunder(BBMacd,banda_supe)  and (avg>avg2) and (MAvg>PMax) and nz(MAvg[10]) > nz(PMax[10]) : crossunder(BBMacd,banda_supe)  and (avg>avg4) and (MAvg>PMax) and nz(MAvg[15]) > nz(PMax[15])
plotshape(tp1 and tp1show, title="TP1", text="TP1", location=location.abovebar, style=shape.labeldown, size=size.tiny, color=color.aqua, textcolor=color.white,transp=0)

plot(T31Show ? T3 : na, color=color_1, linewidth=3, title="T3")
plot(T32Show ? T33 : na, color=color_4, linewidth=3, title="T3 Filter")
plot(T3FiboLine and T32 ? T32 : na, color=color2, linewidth=2, title="T3fibo")
plot(showsupport ? MAvg : na, color=#0585E1, linewidth=2, title="Moving Avg Line")
pALL=plot(PMax, color=color.red, linewidth=2, title="PMax", transp=100)
alertcondition(crossover(MAvg, PMax), title="1- Alım Sinyali", message="{{ticker}}, kapanış fiyatı = {{close}} için Alım Sinyali!")
alertcondition(crossunder(MAvg, PMax), title="2- Satım Sinyali", message="{{ticker}}, kapanış fiyatı = {{close}} için Satım Sinyali!")


buySignalk = filtrelemeacik ? filtreleme ? (crossover(MAvg, PMax) and T33>T3) : (crossover(MAvg, PMax) and src>T3): crossover(MAvg, PMax)


plotshape(buySignalk and showsignalsk ? PMax*0.995 : na, title="AL", text="AL", location=location.absolute, style=shape.labelup, size=size.tiny, color=color.green, textcolor=color.white, transp=0)
sellSignallk = crossunder(MAvg, PMax)
plotshape(sellSignallk and showsignalsk ? PMax*1.005 : na, title="Sat", text="SAT", location=location.absolute, style=shape.labeldown, size=size.tiny, color=color.red, textcolor=color.white, transp=0)
buySignalc = crossover(src, PMax)
plotshape(buySignalc and showsignalsc ? PMax*0.995 : na, title="AL-Fiyat", text="AL", location=location.absolute, style=shape.labelup, size=size.tiny, color=#0F18BF, textcolor=color.white, transp=0)
sellSignallc = crossunder(src, PMax)
plotshape(sellSignallc and showsignalsc ? PMax*1.005 : na, title="Sat-Fiyat", text="SAT", location=location.absolute, style=shape.labeldown, size=size.tiny, color=#0F18BF, textcolor=color.white, transp=0)
mPlot = plot(ohlc4, title="", style=plot.style_circles, linewidth=0,display=display.none)
longFillColor = highlighting ? (MAvg>PMax ? color.green : na) : na
shortFillColor = highlighting ? (MAvg<PMax ? color.red : na) : na
fill(mPlot, pALL, title="Yükseliş Trend Bulutu", color=longFillColor)
fill(mPlot, pALL, title="Düşüş Trend Bulutu", color=shortFillColor)


tplevel = 0
//tplevel := tp1 ? nz(tplevel[1])==0 ? 1 : nz(tplevel[1])==1 ? 2 : 0 : nz(tplevel[1])==0 ? 0 : nz(tplevel[1])==1 ? 1 : nz(tplevel[1])==2 ? 2 : sellSignallk ? 0 : 0
//tplevel := sellSignallk or MAvg < PMax ? 0 : tp1 and nz(tplevel[1])==8 ? 9 : tp1 and nz(tplevel[1])==7 ? 8 : tp1 and nz(tplevel[1])==6 ? 7 : tp1 and nz(tplevel[1])==5 ? 6 : tp1 and nz(tplevel[1])==4 ? 5 : tp1 and nz(tplevel[1])==3 ? 4 : tp1 and nz(tplevel[1])==2 ? 3 : tp1 and nz(tplevel[1])==1 ? 2 : nz(tplevel[1])==1 ? 1 : nz(tplevel[1])==2 ? 2 : nz(tplevel[1])==3 ? 3 : nz(tplevel[1])==4 ? 4 : nz(tplevel[1])==5 ? 5 : nz(tplevel[1])==6 ? 6 : nz(tplevel[1])==7 ? 7 : nz(tplevel[1])==8 ? 8 : nz(tplevel[1])==9 ? 9 : 1
tplevel := sellSignallk or MAvg < PMax ? 0 : Trail1 < Trail2 ? 0 : tp1 and nz(tplevel[1])==1 ? 2 : nz(tplevel[1])==1 ? 1 : nz(tplevel[1])==2 ? 2 : 1

exitlevel = 0

exitlevel := sellSignallk or MAvg < PMax ? 0 : Sell and  nz(tplevel[1])==2 and nz(exitlevel[1])==1 ? 2 : Sell and  nz(tplevel[1])==2 and nz(exitlevel[1])==2 ? 3 : Sell and  nz(tplevel[1])==2 and nz(exitlevel[1])==3 ? 4 :  Sell and  nz(tplevel[1])==2 and nz(exitlevel[1])==4 ? 5: nz(exitlevel[1])==1 ? 1  : nz(exitlevel[1])==2 ? 2 : nz(exitlevel[1])==3 ? 3 : nz(exitlevel[1])==4 ? 4 : nz(exitlevel[1])==5 ? 5:  1

plotchar(tplevel==0 and tplevelshow, char='0', color=color.green)
plotchar(tplevel==1 and tplevelshow , char='1', color=color.green)
plotchar(tplevel==2 and tplevelshow, char='2', color=color.green)


plotshape(exitlevel==0 and tplevelshow , text='0', location=location.belowbar, style=shape.triangledown, color=color.red)
plotshape(exitlevel==1 and tplevelshow , text='1', location=location.belowbar, style=shape.triangledown, color=color.red)
plotshape(exitlevel==2 and tplevelshow , text='2', location=location.belowbar, style=shape.triangledown, color=color.red)
plotshape(exitlevel==3 and tplevelshow , text='3', location=location.belowbar, style=shape.triangledown, color=color.red)
plotshape(exitlevel==4 and tplevelshow , text='4', location=location.belowbar, style=shape.triangledown, color=color.red)
plotshape(exitlevel==5 and tplevelshow , text='5', location=location.belowbar, style=shape.triangledown, color=color.red)

plotshape(nz(tplevel[1])==2 and Sell and exitlevel>=2, title="TP", text="TP", location=location.abovebar, style=shape.labeldown, size=size.tiny, color=color.lime, textcolor=color.white,transp=0)

if (buySignalk)
    strategy.entry("Buy", strategy.long)

if nz(tplevel[1])==2 and Sell and exitlevel==2
    strategy.exit ("Exit1", from_entry="Buy", limit=close, qty_percent = 33.3)

//if nz(tplevel[1])==2 and Sell and exitlevel==3
  //  strategy.exit ("Exit2", from_entry="Buy", limit=close, qty_percent = 33.3)

if nz(tplevel[1])==2 and Sell and exitlevel==3
    strategy.exit ("Exit2", from_entry="Buy", limit=close, qty_percent = 50)

if nz(tplevel[1])==2 and Sell and exitlevel==4
    strategy.exit ("Exit3", from_entry="Buy", limit=close)


if (sellSignallk)
    strategy.close_all()