Stratégie de suivi de tendance basée sur les stop loss EMA et ATR

Aperçu
La stratégie utilise une EMA équilibrée à la croix dorée pour générer un signal de transaction, c'est-à-dire un signal d'achat lorsque la ligne EMA rapide traverse la ligne EMA lente et un signal de vente lorsque la ligne EMA rapide traverse la ligne EMA lente. Cette stratégie est une stratégie de suivi de tendance typique.
Principe de stratégie
- La définition de l'EMA rapide est de 13, celle de l'EMA lente de 48.
- Un signal d'achat est généré lorsque la ligne EMA rapide traverse la ligne EMA lente; un signal de vente est généré lorsque la ligne EMA rapide traverse la ligne EMA lente.
- Les fonctions ta.crossover et ta.crossunder sont utilisées pour déterminer la résistance de la fourche.
- L'indicateur ATR est utilisé pour calculer le stop-loss dynamique, qui est 1,5 fois l'ATR de la distance d'arrêt la plus proche.
- Les signaux de négociation et les points de rupture sont visuellement affichés à l'aide de changements de couleur, de marqueurs de vente et d'achat, et de lignes de stop.
Analyse des forces stratégiques
- La fourche dorée basée sur la ligne moyenne EMA génère des signaux pour éviter de manquer les principales tendances du marché, et les gains sont considérables.
- L'arrêt de suivi dynamique ATR assure un profit suffisant et maîtrise le risque de retrait, et le risque-bénéfice global est relativement équilibré.
- L'affichage des signaux et de l'indicateur d'arrêt est intuitif, simple à utiliser et adapté à la plupart des utilisateurs.
- Il y a moins de paramètres à ajuster, plus facile à maîtriser et à optimiser.
Analyse stratégique des risques
- La chute soudaine peut déclencher un arrêt des pertes.
- Les tremblements de terre peuvent provoquer des signaux de défaillance fréquents.
- Une mauvaise configuration des paramètres peut entraîner une entrée trop intense ou une fin de course trop détendue.
- Les paramètres EMA et ATR doivent être optimisés.
La solution est simple:
- Le multiplicateur ATR peut être allégé de manière appropriée pour assurer une certaine réserve de stop loss par rapport au plus haut de la période.
- On peut envisager des mécanismes de confirmation après la génération du signal, tels que des hauts avant la rupture des prix.
- L'optimisation des paramètres est recommandée en tenant compte de diverses conditions du marché.
Orientation de l'optimisation de la stratégie
- Il est possible de tester différentes combinaisons de paramètres pour trouver le paramètre optimal.
- Il est possible d'envisager d'ajouter d'autres indicateurs pour filtrer le signal, tels que les indicateurs de trafic, les indicateurs de fluctuation, etc., pour améliorer la qualité du signal.
- Les paramètres EMA peuvent être ajustés en fonction de la tendance à grande échelle pour mieux capturer les principales tendances.
- On peut envisager d'ajuster dynamiquement le coefficient de stop ATR et d'élargir le périmètre de stop en cas de tendance.
- Les algorithmes d'apprentissage automatique peuvent être combinés avec des paramètres d'optimisation adaptatifs.
Résumer
La stratégie est généralement simple et facile à utiliser. Elle génère des signaux basés sur la courbe moyenne EMA. Elle peut être complétée par un indicateur ATR pour suivre les pertes et contrôler efficacement le risque. Bien qu'il y ait des faux signaux, la capacité de capter les principales tendances est forte, les gains sont stables et l'une des stratégies de base pour les transactions quantifiées.
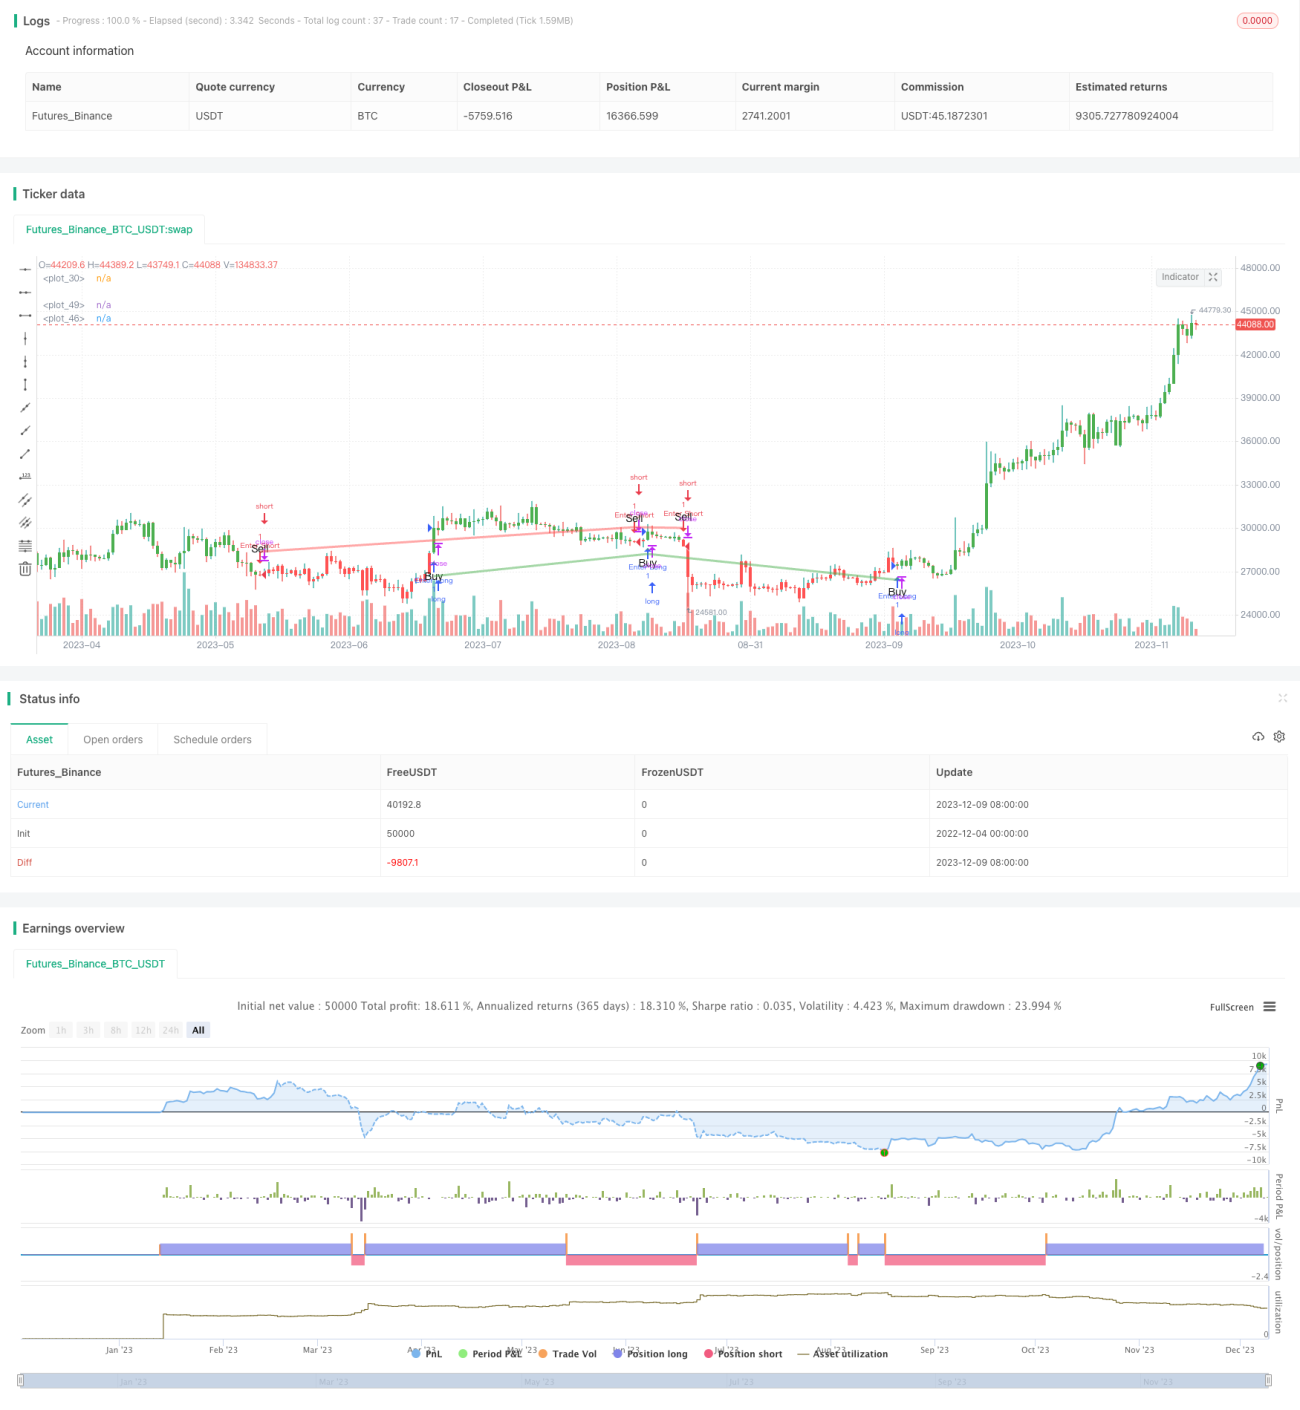
/*backtest
start: 2022-12-04 00:00:00
end: 2023-12-10 00:00:00
period: 1d
basePeriod: 1h
exchanges: [{"eid":"Futures_Binance","currency":"BTC_USDT"}]
*/

// This source code is subject to the terms of the Mozilla Public License 2.0 at https://mozilla.org/MPL/2.0/
// © byee322

/// This strategy uses the EMA to generate buy and sell signals with a 1.5x ATR stop loss- 1