
Il s’agit d’une stratégie de trading quantitative qui utilise les points de support comme signal d’entrée. Elle calcule les points de support à la hausse et à la baisse et lance une position longue ou courte dès que le prix franchit ces points de support.
Cette stratégie est basée sur la théorie de l’inversion des points de repère. Elle calcule d’abord les points de repère de la racine K de la racine N à gauche et de la racine K de la racine M à droite.
Lorsque le prix franchit le support de la hausse, cela signifie que la force de ranchang n’est plus suffisante pour continuer à faire monter le prix, alors le shorting peut obtenir un meilleur rendement. Lorsque le prix franchit le support de la baisse, cela signifie que la force aérienne est épuisée, alors faire plus peut obtenir un meilleur rendement.
Plus précisément, la stratégie utilise les fonctions ta.pivothigh et ta.pivotlow pour calculer les points d’appui à la hausse et les points d’appui à la baisse. Ensuite, il est comparé si le prix le plus élevé actuel a franchi le point d’appui à la hausse et si le prix le plus bas a franchi le point d’appui à la baisse.
En outre, la stratégie utilise également le stop loss pour contrôler le risque. En particulier, lorsque le prix dépasse le support, l’ordre est immédiatement commandé, tout en fixant le stop loss de l’autre côté du support, afin d’éviter au maximum l’expansion des pertes causées par les singles défaillants.
Cette stratégie basée sur la rotation des points d’appui présente les avantages suivants:
Cette stratégie comporte également des risques à prendre en compte:
Pour atténuer les risques, il faut tenir compte des points suivants:
Il y a encore de la place pour optimiser cette stratégie:
Ces optimisations peuvent améliorer la probabilité de succès, la rentabilité et la stabilité de la stratégie.
Dans l’ensemble, il s’agit d’une stratégie de trading quantitatif basée sur la théorie de l’inversion des points de repère. Elle utilise les points de rupture des prix comme signaux de trading, tout en utilisant un mécanisme de contrôle des risques de stop loss. La stratégie est facile à mettre en œuvre, est largement applicable et constitue une stratégie de trading quantitatif pratique.
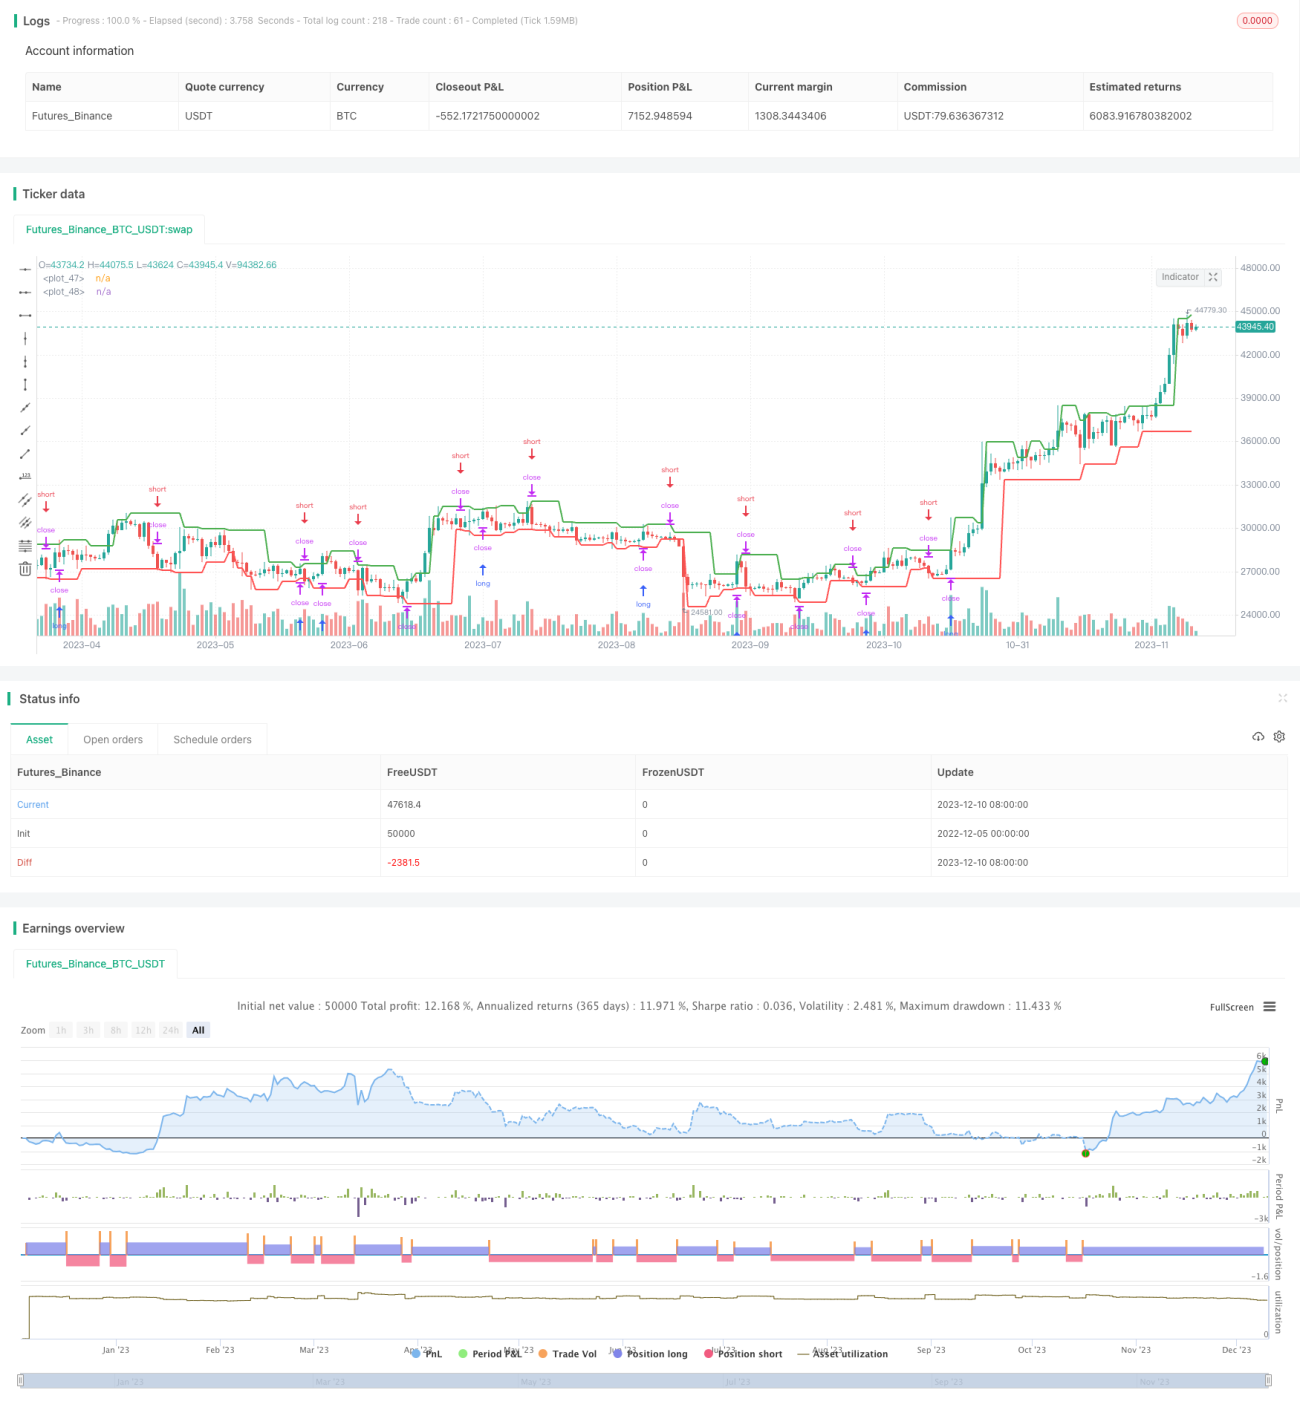
/*backtest
start: 2022-12-05 00:00:00
end: 2023-12-11 00:00:00
period: 1d
basePeriod: 1h
exchanges: [{"eid":"Futures_Binance","currency":"BTC_USDT"}]
*/
//@version=5
strategy('Weekly Returns with Benchmark', overlay=true,
default_qty_type=strategy.percent_of_equity, default_qty_value=25,
commission_type=strategy.commission.percent, commission_value=0.1)
////////////
// Inputs //
// Pivot points inputs
leftBars = input(2, group = "Pivot Points")
rightBars = input(1, group = "Pivot Points")
// Styling inputs
prec = input(1, title='Return Precision', group = "Weekly Table")
from_date = input(timestamp("01 Jan 3000 00:00 +0000"), "From Date", group = "Weekhly Table")
prof_color = input.color(color.green, title = "Gradient Colors", group = "Weeky Table", inline = "colors")
loss_color = input.color(color.red, title = "", group = "Weeky Table", inline = "colors")
// Benchmark inputs
use_cur = input.bool(true, title = "Use current Symbol for Benchmark", group = "Benchmark")
symb_bench = input('BTC_USDT:swap', title = "Benchmark", group = "Benchmark")
disp_bench = input.bool(false, title = "Display Benchmark?", group = "Benchmark")
disp_alpha = input.bool(false, title = "Display Alpha?", group = "Benchmark")
// Pivot Points Strategy
swh = ta.pivothigh(leftBars, rightBars)
swl = ta.pivotlow (leftBars, rightBars)
hprice = 0.0
hprice := not na(swh) ? swh : hprice[1]
lprice = 0.0
lprice := not na(swl) ? swl : lprice[1]
le = false
le := not na(swh) ? true : le[1] and high > hprice ? false : le[1]
se = false
se := not na(swl) ? true : se[1] and low < lprice ? false : se[1]
if le
strategy.entry('PivRevLE', strategy.long, comment='PivRevLE', stop=hprice + syminfo.mintick)
if se
strategy.entry('PivRevSE', strategy.short, comment='PivRevSE', stop=lprice - syminfo.mintick)
plot(hprice, color=color.new(color.green, 0), linewidth=2)
plot(lprice, color=color.new(color.red, 0), linewidth=2)
///////////////////
// WEEKLY TABLE //
new_week = weekofyear(time[1]) != weekofyear(time)
new_year = year(time) != year(time[1])
eq = strategy.equity
bench_eq = close
// benchmark eq
bench_eq_htf = request.security(symb_bench, timeframe.period, close)
if (not use_cur)
bench_eq := bench_eq_htf
bar_pnl = eq / eq[1] - 1
bench_pnl = bench_eq / bench_eq[1] - 1
// Current Weekly P&L
cur_week_pnl = 0.0
cur_week_pnl := bar_index == 0 ? 0 :
time >= from_date and (time[1] < from_date or new_week) ? bar_pnl :
(1 + cur_week_pnl[1]) * (1 + bar_pnl) - 1
// Current Yearly P&L
cur_year_pnl = 0.0
cur_year_pnl := bar_index == 0 ? 0 :
time >= from_date and (time[1] < from_date or new_year) ? bar_pnl :
(1 + cur_year_pnl[1]) * (1 + bar_pnl) - 1
// Current Weekly P&L - Bench
bench_cur_week_pnl = 0.0
bench_cur_week_pnl := bar_index == 0 or (time[1] < from_date and time >= from_date) ? 0 :
time >= from_date and new_week ? bench_pnl :
(1 + bench_cur_week_pnl[1]) * (1 + bench_pnl) - 1
// Current Yearly P&L - Bench
bench_cur_year_pnl = 0.0
bench_cur_year_pnl := bar_index == 0 ? 0 :
time >= from_date and (time[1] < from_date or new_year) ? bench_pnl :
(1 + bench_cur_year_pnl[1]) * (1 + bench_pnl) - 1
var week_time = array.new_int(0)
var year_time = array.new_int(0)
var week_pnl = array.new_float(0)
var year_pnl = array.new_float(0)
var bench_week_pnl = array.new_float(0)
var bench_year_pnl = array.new_float(0)
// Filling weekly / yearly pnl arrays
if array.size(week_time) > 0
if weekofyear(time) == weekofyear(array.get(week_time, array.size(week_time) - 1))
array.pop(week_pnl)
array.pop(bench_week_pnl)
array.pop(week_time)
if array.size(year_time) > 0
if year(time) == year(array.get(year_time, array.size(year_time) - 1))
array.pop(year_pnl)
array.pop(bench_year_pnl)
array.pop(year_time)
if (time >= from_date)
array.push(week_time, time)
array.push(year_time, time)
array.push(week_pnl, cur_week_pnl)
array.push(year_pnl, cur_year_pnl)
array.push(bench_year_pnl, bench_cur_year_pnl)
array.push(bench_week_pnl, bench_cur_week_pnl)
// Weekly P&L Table
table_size = size.tiny
var weekly_table = table(na)
if array.size(year_pnl) > 0 and barstate.islastconfirmedhistory
weekly_table := table.new(position.bottom_right,
columns=56, rows=array.size(year_pnl) * 3 + 5, border_width=1)
// Fill weekly performance
table.cell(weekly_table, 0, 0, 'Perf',
bgcolor = #999999, text_size= table_size)
for numW = 1 to 53 by 1
table.cell(weekly_table, numW, 0, str.tostring(numW),
bgcolor= #999999, text_size= table_size)
table.cell(weekly_table, 54, 0, ' ',
bgcolor = #999999, text_size= table_size)
table.cell(weekly_table, 55, 0, 'Year',
bgcolor = #999999, text_size= table_size)
max_abs_y = math.max(math.abs(array.max(year_pnl)), math.abs(array.min(year_pnl)))
max_abs_m = math.max(math.abs(array.max(week_pnl)), math.abs(array.min(week_pnl)))
for yi = 0 to array.size(year_pnl) - 1 by 1
table.cell(weekly_table, 0, yi + 1,
str.tostring(year(array.get(year_time, yi))),
bgcolor=#cccccc, text_size=table_size)
table.cell(weekly_table, 53, yi + 1, ' ',
bgcolor=#999999, text_size=table_size)
table.cell(weekly_table, 54, yi + 1, ' ',
bgcolor=#999999, text_size=table_size)
y_color = color.from_gradient(array.get(year_pnl, yi), -max_abs_y, max_abs_y, loss_color, prof_color)
table.cell(weekly_table, 55, yi + 1,
str.tostring(math.round(array.get(year_pnl, yi) * 100, prec)),
bgcolor=y_color, text_size=table_size)
int iw_row= na
int iw_col= na
for wi = 0 to array.size(week_time) - 2 by 1
w_row = year(array.get(week_time, wi)) - year(array.get(year_time, 0)) + 1
w_col = weekofyear(array.get(week_time, wi))
w_color = color.from_gradient(array.get(week_pnl, wi), -max_abs_m, max_abs_m, loss_color, prof_color)
if iw_row + 1 == w_row and iw_col + 1 == w_col
table.cell(weekly_table, w_col, w_row-1,
str.tostring(math.round(array.get(week_pnl, wi) * 100, prec)),
bgcolor=w_color, text_size=table_size)
else
table.cell(weekly_table, w_col, w_row,
str.tostring(math.round(array.get(week_pnl, wi) * 100, prec)),
bgcolor=w_color, text_size=table_size)
iw_row:= w_row
iw_col:= w_col
// Fill benchmark performance
next_row = array.size(year_pnl) + 1
if (disp_bench)
table.cell(weekly_table, 0, next_row, 'Bench',
bgcolor=#999999, text_size=table_size)
for numW = 1 to 53 by 1
table.cell(weekly_table, numW, next_row, str.tostring(numW),
bgcolor= #999999, text_size= table_size)
table.cell(weekly_table, 54, next_row, ' ' ,
bgcolor = #999999, text_size=table_size)
table.cell(weekly_table, 55, next_row, 'Year',
bgcolor = #999999, text_size=table_size)
max_bench_abs_y = math.max(math.abs(array.max(bench_year_pnl)), math.abs(array.min(bench_year_pnl)))
max_bench_abs_w = math.max(math.abs(array.max(bench_week_pnl)), math.abs(array.min(bench_week_pnl)))
for yi = 0 to array.size(year_time) - 1 by 1
table.cell(weekly_table, 0, yi + 1 + next_row + 1,
str.tostring(year(array.get(year_time, yi))),
bgcolor=#cccccc, text_size=table_size)
table.cell(weekly_table, 53, yi + 1 + next_row + 1, ' ',
bgcolor=#999999, text_size=table_size)
table.cell(weekly_table, 54, yi + 1 + next_row + 1, ' ',
bgcolor=#999999, text_size=table_size)
y_color = color.from_gradient(array.get(bench_year_pnl, yi), -max_bench_abs_y, max_bench_abs_y, loss_color, prof_color)
table.cell(weekly_table, 55, yi + 1 + next_row + 1,
str.tostring(math.round(array.get(bench_year_pnl, yi) * 100, prec)),
bgcolor=y_color, text_size=table_size)
int iw_row1= na
int iw_col1= na
for wi = 0 to array.size(week_time) - 1 by 1
w_row = year(array.get(week_time, wi)) - year(array.get(year_time, 0)) + 1
w_col = weekofyear(array.get(week_time, wi))
w_color = color.from_gradient(array.get(bench_week_pnl, wi), -max_bench_abs_w, max_bench_abs_w, loss_color, prof_color)
if iw_row1 + 1 == w_row and iw_col1 + 1 == w_col
table.cell(weekly_table, w_col, w_row + next_row ,
str.tostring(math.round(array.get(bench_week_pnl, wi) * 100, prec)),
bgcolor=w_color, text_size=table_size)
else
table.cell(weekly_table, w_col, w_row + next_row + 1,
str.tostring(math.round(array.get(bench_week_pnl, wi) * 100, prec)),
bgcolor=w_color, text_size=table_size)
iw_row1:= w_row
iw_col1:= w_col
// Fill Alpha
if (disp_alpha)
// columns
next_row := array.size(year_pnl) * 2 + 3
table.cell(weekly_table, 0, next_row, 'Alpha',
bgcolor=#999999, text_size= table_size)
for numW = 1 to 53 by 1
table.cell(weekly_table, numW, next_row, str.tostring(numW),
bgcolor= #999999, text_size= table_size)
table.cell(weekly_table, 54, next_row, ' ' ,
bgcolor=#999999, text_size= table_size)
table.cell(weekly_table, 55, next_row, 'Year',
bgcolor=#999999, text_size= table_size)
max_alpha_abs_y = 0.0
for yi = 0 to array.size(year_time) - 1 by 1
if (math.abs(array.get(year_pnl, yi) - array.get(bench_year_pnl, yi)) > max_alpha_abs_y)
max_alpha_abs_y := math.abs(array.get(year_pnl, yi) - array.get(bench_year_pnl, yi))
max_alpha_abs_w = 0.0
for wi = 0 to array.size(week_pnl) - 1 by 1
if (math.abs(array.get(week_pnl, wi) - array.get(bench_week_pnl, wi)) > max_alpha_abs_w)
max_alpha_abs_w := math.abs(array.get(week_pnl, wi) - array.get(bench_week_pnl, wi))
for yi = 0 to array.size(year_time) - 1 by 1
table.cell(weekly_table, 0, yi + 1 + next_row + 1,
str.tostring(year(array.get(year_time, yi))),
bgcolor=#cccccc, text_size= table_size)
table.cell(weekly_table, 53, yi + 1 + next_row + 1, ' ',
bgcolor=#999999, text_size= table_size)
table.cell(weekly_table, 54, yi + 1 + next_row + 1, ' ',
bgcolor=#999999, text_size= table_size)
y_color = color.from_gradient(array.get(year_pnl, yi) - array.get(bench_year_pnl, yi), -max_alpha_abs_y, max_alpha_abs_y, loss_color, prof_color)
table.cell(weekly_table, 55, yi + 1 + next_row + 1,
str.tostring(math.round((array.get(year_pnl, yi) - array.get(bench_year_pnl, yi)) * 100, prec)),
bgcolor=y_color, text_size= table_size)
int iw_row2= na
int iw_col2= na
for wi = 0 to array.size(week_time) - 1 by 1
w_row = year(array.get(week_time, wi)) - year(array.get(year_time, 0)) + 1
w_col = weekofyear(array.get(week_time, wi))
w_color = color.from_gradient(array.get(week_pnl, wi) - array.get(bench_week_pnl, wi), -max_alpha_abs_w, max_alpha_abs_w, loss_color, prof_color)
if iw_row2 + 1 == w_row and iw_col2 + 1 == w_col
table.cell(weekly_table, w_col, w_row + next_row ,
str.tostring(math.round((array.get(week_pnl, wi) - array.get(bench_week_pnl, wi)) * 100, prec)),
bgcolor=w_color, text_size= table_size)
else
table.cell(weekly_table, w_col, w_row + next_row + 1 ,
str.tostring(math.round((array.get(week_pnl, wi) - array.get(bench_week_pnl, wi)) * 100, prec)),
bgcolor=w_color, text_size= table_size)
iw_row2:= w_row
iw_col2:= w_col