Stratégie de cassure de la moyenne mobile de la super tendance triple
Aperçu
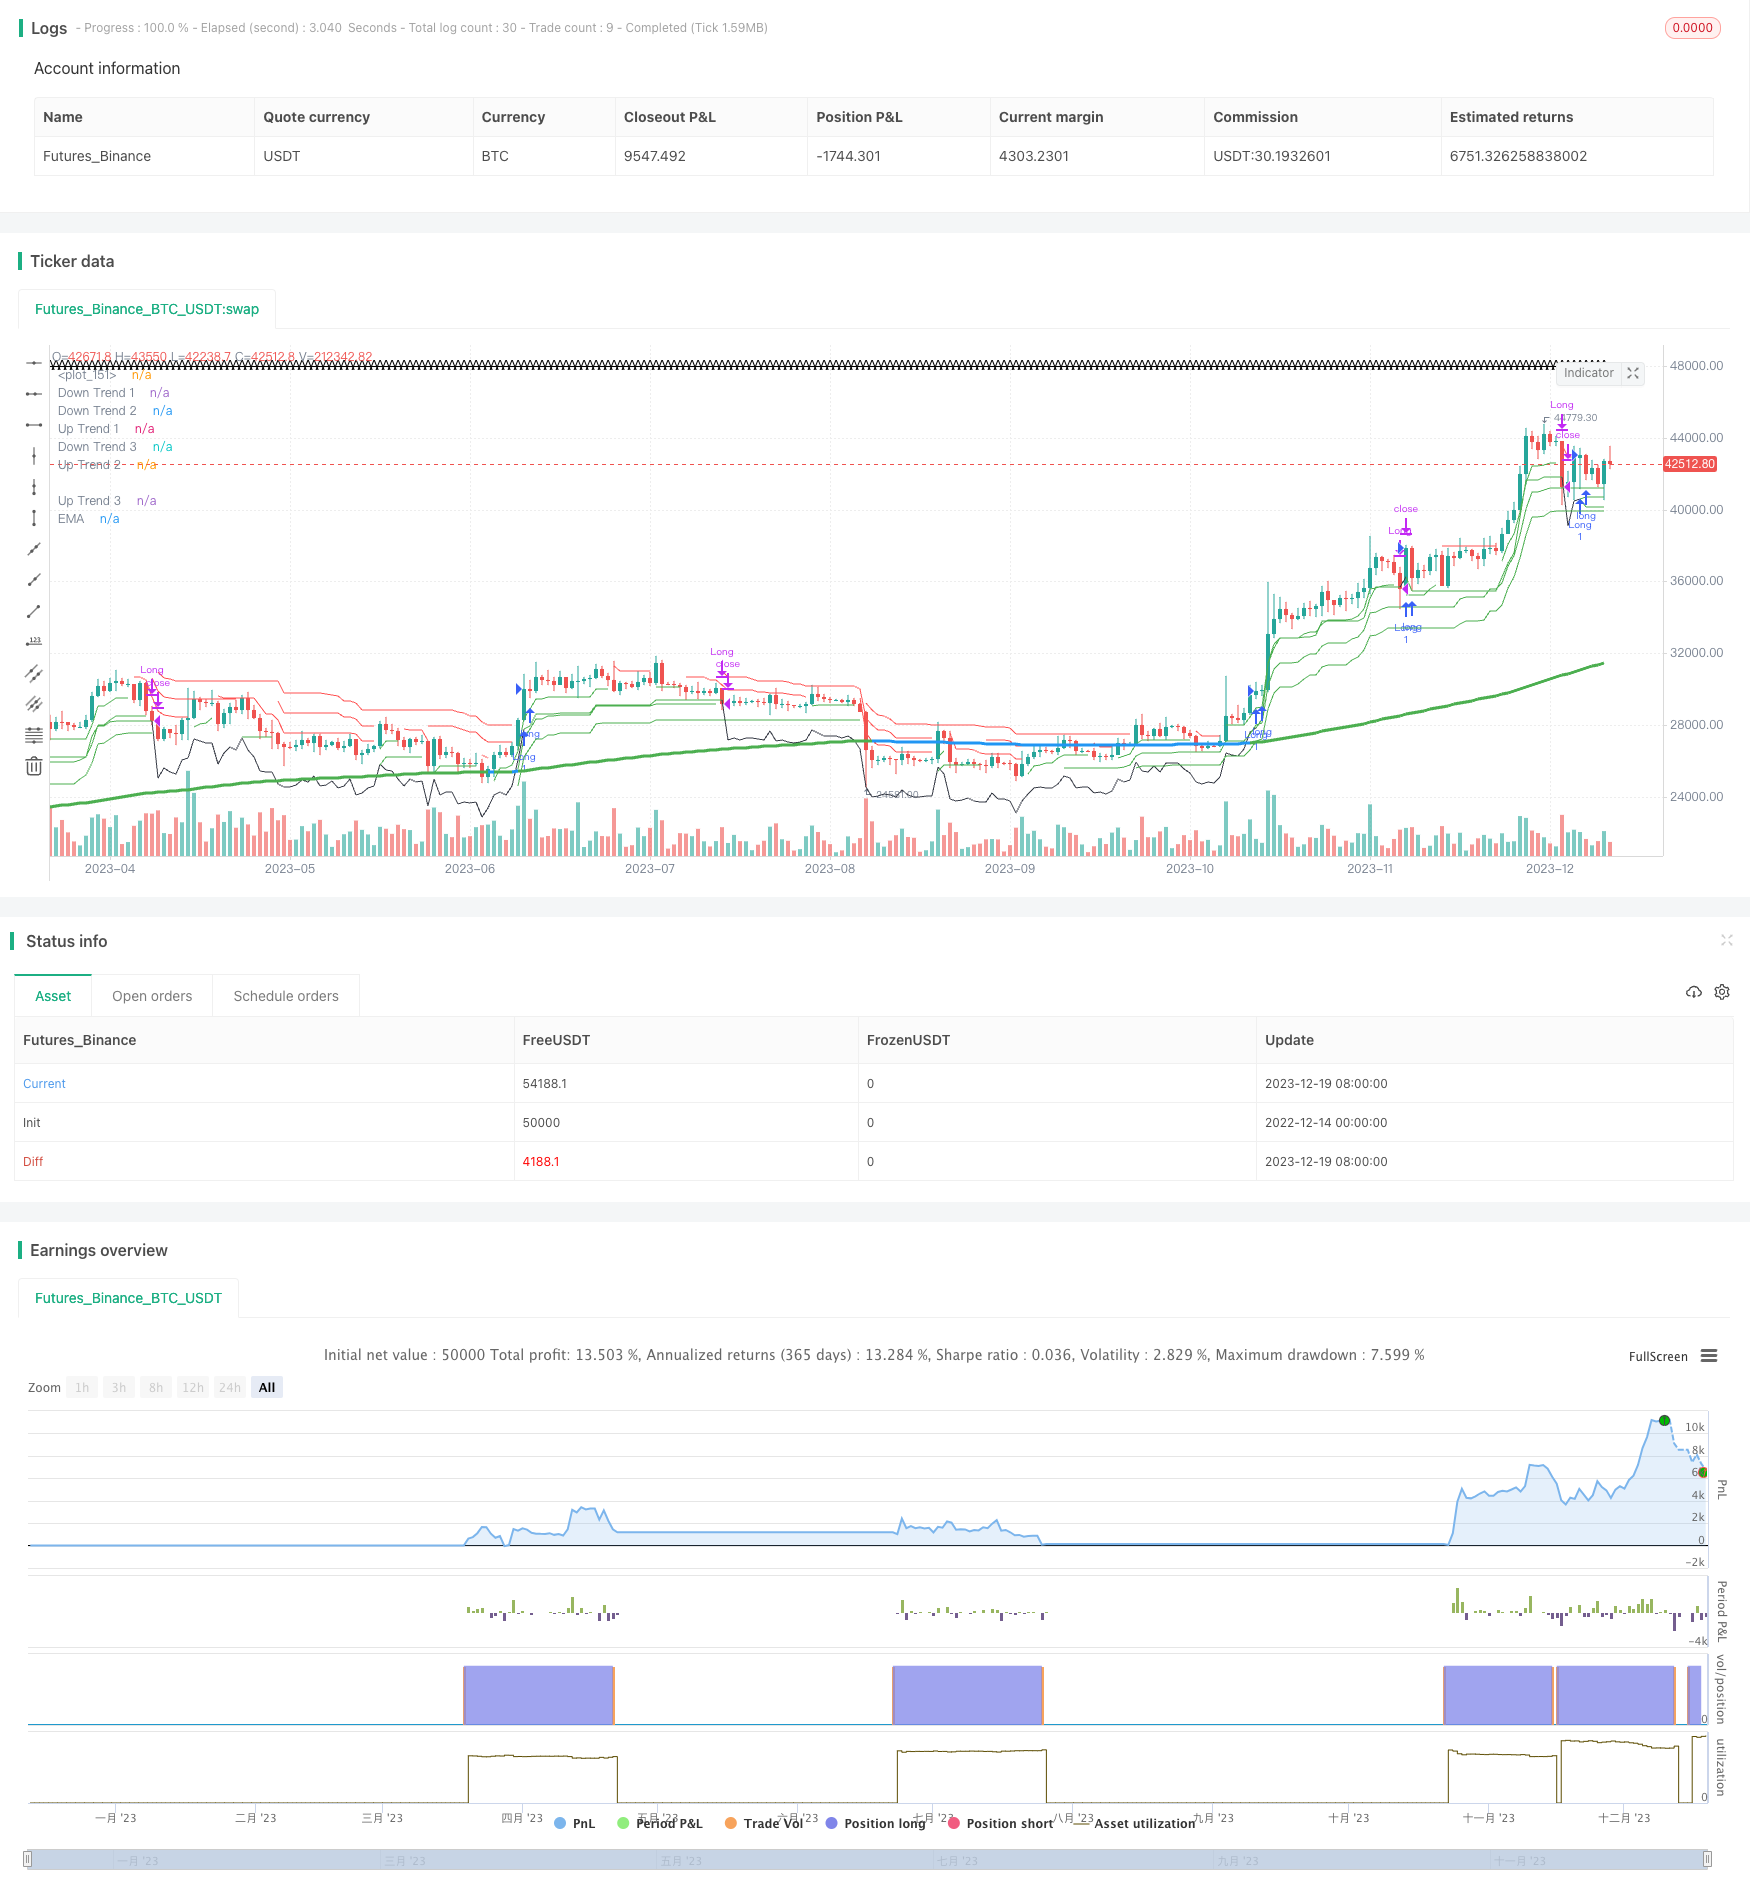
La stratégie de triple rupture de la courbe de tendance supérieure est une stratégie de négociation plus courante qui utilise la courbe de tendance supérieure avec plusieurs paramètres différents et l’EMA de la tendance définie pour identifier la direction de la tendance et effectuer des transactions. L’idée principale de cette stratégie est de créer une courbe de tendance supérieure lorsque au moins deux courbes de la courbe de tendance supérieure sont en position verticale au-dessus de l’EMA de la tendance définie.
Principe de stratégie
La stratégie détermine les positions positives et négatives en définissant une moyenne hypertrend de trois paramètres différents et une EMA qui définit la direction de la grande tendance:
Il y a trois lignes supertrend supertrend1, supertrend2 et supertrend3, les couleurs étant respectivement le vert pour la tendance haussière et le rouge pour la tendance baissière.
La définition d’une EMA comme une moyenne mobile élastique ematrend définit la grande tendance, définie comme une tendance à la hausse de la grande fourchette lorsque les trois moyennes hypertrend sont toutes supérieures à cette EMA, et inversement définie comme une tendance à la baisse.
Lorsqu’au moins deux lignes de tendance supérieure à la moyenne sont affichées simultanément en vert, c’est-à-dire que la valeur de direction est inférieure à 0, le signal est jugé comme un signal de tendance supérieure à la moyenne. Lorsqu’au moins deux lignes de tendance supérieure à la moyenne sont affichées simultanément en rouge, c’est-à-dire que la valeur de direction est supérieure à 0, le signal est jugé comme vide.
Il est ensuite possible d’ouvrir une position en plus/en moins au signal.
La condition de stop-loss est définie. Le stop-loss fixe est défini comme le ratio de risque-rendement, soit le ratio de profit-perte de 3; le stop-loss mobile est défini comme le stop-loss d’une ATR baissée.
Lorsque les conditions de stop loss ou d’arrêt sont déclenchées, la position est levée.
Analyse des avantages
Cette stratégie présente les avantages suivants:
L’utilisation d’une triple ligne moyenne hypertrend combinée à une EMA pour déterminer la tendance permet d’identifier efficacement les signaux de tendance.
Les règles de la conditionnalité de la pluralité sont claires, faciles à comprendre et à mettre en œuvre.
La mise en place d’un arrêt mobile et d’un arrêt fixe permet de contrôler efficacement les risques.
Les hyperparamètres peuvent être modifiés au besoin pour optimiser la stratégie.
Analyse des risques
Cette stratégie comporte aussi des risques:
Une mauvaise configuration des hyperparamètres peut entraîner la perte de bonnes opportunités de trading. Différents paramètres ATR, ATR multiples et EMA peuvent être testés.
La probabilité d’échec d’une percée existe et peut être réduite en ajustant les paramètres de surdose.
Un arrêt de perte ou un arrêt trop lâche augmente la probabilité de perte. La portée de l’arrêt de perte doit être réduite de manière appropriée.
Les données de retouche peuvent générer des problèmes de surcorrespondance. Attention aux tests multi-marchés et multi-cycles.
Direction d’optimisation
Cette stratégie peut être optimisée dans les domaines suivants:
Il est possible de tester différentes combinaisons de cycles ATR, de multiples ATR et de cycles de moyenne EMA pour trouver les meilleurs paramètres.
Augmentation de la variété des transactions. Vous pouvez ajouter des variétés différentes telles que des actions, des monnaies numériques et d’autres pour vérifier l’efficacité de la stratégie.
Il est possible d’ajouter des indicateurs tels que le RSI, le MACD, etc. pour éviter de mal interpréter les signaux de tendance.
Optimisation des mécanismes d’arrêt des pertes. On peut tester le suivi des pertes, ou les méthodes d’arrêt basées sur les variations de l’ATR/taux de fluctuation.
Résumer
La stratégie de rupture de la triple ligne moyenne est une stratégie de suivi de la tendance plus simple et plus pratique dans l’ensemble. Elle combine plusieurs lignes moyennes de la tendance et des EMA de jugement de la tendance pour trouver des opportunités et contrôler efficacement les risques.
/*backtest
start: 2022-12-14 00:00:00
end: 2023-12-20 00:00:00
period: 1d
basePeriod: 1h
exchanges: [{"eid":"Futures_Binance","currency":"BTC_USDT"}]
*/

// @version=5
// author=theasgard and moonshot-indicator (ms)
// year 2021
//
// This is a well knowen strategy by using 3 different Supertrends and a trend-defining EMA,
// feel free to play around with the settings, a backtest on 8h ETHUSDT pair brought some good results using
// the 233EMA and investing 75% of a 10k start capital
//
// the idea is to have at least 2 supertrnds going green above the trend-EMA to go long and exit by turning
// 2 supertrends red (idea: 1 supertrend in red could initialize a take profit)
// shorts work vice versa
// The EMA shows in green for uptrends and in red for downtrends, if it is blue no Signal will be taken because
// the 3 supertrends are not all above or below the trendline(EMA)
//
// Update 1:
// Fixed a minor input error
// Added ATR stoploss, and commented out the percentage stop loss
// Added time window to backtest
// Added exit on risk/revard is met
// This version is only buy...wait for next update adding shorts

strategy("ms hypertrender", overlay=true)

// set up 3 supertrendlines and colour the direction up/down
atrPeriod1 = input(10, "ATR Length 1")
factor1 = input.float(1.0, "ATR Factor 1", step = 0.01)
[supertrend1, direction1] = ta.supertrend(factor1, atrPeriod1)
upTrend1 = plot(direction1 < 0 ? supertrend1 : na, "Up Trend 1", color = color.green, style=plot.style_linebr)
downTrend1 = plot(direction1 < 0? na : supertrend1, "Down Trend 1", color = color.red, style=plot.style_linebr)

atrPeriod2 = input(11, "ATR Length 2")
factor2 = input.float(2.0, "ATR Factor 2", step = 0.01)
[supertrend2, direction2] = ta.supertrend(factor2, atrPeriod2)
upTrend2 = plot(direction2 < 0 ? supertrend2 : na, "Up Trend 2", color = color.green, style=plot.style_linebr)
downTrend2 = plot(direction2 < 0? na : supertrend2, "Down Trend 2", color = color.red, style=plot.style_linebr)

atrPeriod3 = input(12, "ATR Length 3")
factor3 = input.float(3.0, "ATR Factor 3", step = 0.01)
[supertrend3, direction3] = ta.supertrend(factor3, atrPeriod3)
upTrend3 = plot(direction3 < 0 ? supertrend3 : na, "Up Trend 3", color = color.green, style=plot.style_linebr)
downTrend3 = plot(direction3 < 0? na : supertrend3, "Down Trend 3", color = color.red, style=plot.style_linebr)

//set up the trend dividing EMA and color uptrend nutreal downtrend
len = input.int(233, minval=1, title="Trend-EMA Length")
src = input(close, title="Source")
offset = input.int(title="Offset", defval=0, minval=-500, maxval=500)

//general Bull or Bear Trend? Visualized by ema
ematrend = ta.ema(src, len)
generaluptrend = supertrend1 > ematrend and supertrend2 > ematrend and supertrend3 > ematrend
generaldowntrend = supertrend1 < ematrend and supertrend2 < ematrend and supertrend3 < ematrend
emacolor = if generaluptrend
    color.green
else if generaldowntrend
    color.red
else
    color.blue
plot(ematrend, title="EMA", color=emacolor, linewidth=3, offset=offset)

// Bullish? min 2 supertrends green
bullish = (direction1 < 0 and direction2 < 0) or (direction1 < 0 and direction3 < 0) or (direction2 < 0 and direction3 < 0) and generaluptrend
extremebullish = direction1 < 0 and direction2 < 0 and direction3 < 0 and generaluptrend //all 3 green

// Bearish? min 2 supertrends red
bearish = (direction1 > 0 and direction2 > 0) or (direction1 > 0 and direction3 > 0) or (direction2 > 0 and direction3 > 0) and generaldowntrend
extremebearish = direction1 > 0 and direction2 > 0 and direction3 > 0 and generaldowntrend //all 3 red

// Open Long
//plotchar(((bullish and not bullish[1]) or (extremebullish and not extremebullish[1])) and (emacolor==color.green)? close : na, title = 'Start Long', char='▲', color = #80eb34, location = location.belowbar, size = size.small)

// TP 10% Long
TP10long = ((generaluptrend and bullish[1]) or (generaluptrend and extremebullish[1])) and (direction1 > 0 or direction2 > 0 or direction3 > 0)
//plotchar(TP10long and not TP10long[1]? close : na, title = 'TP on Long', char='┼', color = #ffd000, location = location.abovebar, size = size.tiny)

// Exit Long
//plotchar(extremebearish and not extremebearish[1] or bearish and not bearish[1]? close : na, title = 'Close all Longs', char='Ꭓ', color = #ff0037, location = location.abovebar, size = size.tiny)
stopsupertrendup = if supertrend1 < supertrend2 and supertrend1 < supertrend3
    (supertrend1)
else if supertrend2 < supertrend1 and supertrend2 < supertrend3
    (supertrend2)
else if supertrend3 < supertrend1 and supertrend3 < supertrend2
    (supertrend3)
lowestLows = ta.lowest(low, 1)
// Open Short
//plotchar(((bearish and not bearish[1]) or (extremebearish and not extremebearish[1])) and (emacolor==color.red)? close : na, title = 'Start Short', char='▼', color = #0547e3, location = location.abovebar, size = size.small)

// TP 10% Short
TP10short = ((generaldowntrend and bearish[1]) or (generaldowntrend and extremebearish[1])) and (direction1 < 0 or direction2 < 0 or direction3 < 0)
//plotchar(TP10short and not TP10short[1]? close : na, title = 'TP on Short', char='┼', color = #ffd000, location = location.belowbar, size = size.tiny)

// Exit Short
//plotchar(extremebullish and not extremebullish[1] or bullish and not bullish[1]? close : na, title = 'Close all Shorts', char='Ꭓ', color = #ff0037, location = location.belowbar, size = size.tiny)
stopsupertrenddown = if supertrend1 > supertrend2 and supertrend1 > supertrend3
    (supertrend1)
else if supertrend2 > supertrend1 and supertrend2 > supertrend3
    (supertrend2)
else if supertrend3 > supertrend1 and supertrend3 > supertrend2
    (supertrend3)
highestHighs = ta.highest(high,1)
// Set stop loss level with input options (optional)
//longLossPerc = input.float(title="Long Stop Loss (%)",
//     minval=0.0, step=0.1, defval=1) * 0.01

//shortLossPerc = input.float(title="Short Stop Loss (%)",
//     minval=0.0, step=0.1, defval=1) * 0.01

// Determine stop loss price
//longStopPrice  = strategy.position_avg_price * (1 - longLossPerc)
//shortStopPrice = strategy.position_avg_price * (1 + shortLossPerc)

openlong = (extremebullish and not extremebullish[1]) and (emacolor==color.green)//(((bullish and not bullish[1]) or
openshort = (extremebearish and not extremebearish[1]) and (emacolor==color.red)//(((bearish and not bearish[1]) or
exitlong = lowestLows<(stopsupertrendup - ((stopsupertrendup / 100) * 0.1)) //(extremebearish and not extremebearish[1] or bearish and not bearish[1]) or TP10long or
exitshort = highestHighs>(stopsupertrenddown - ((stopsupertrenddown / 100) * 0.1)) //(extremebullish and not extremebullish[1] or bullish and not bullish[1]) or TP10short
//strategy.entry("buy", strategy.long, when=openlong)
//strategy.entry("sell", strategy.short, when=openshort)

//strategy.close("buy", when=exitlong)
//strategy.close("sell", when=exitshort)

// Submit exit orders based on calculated stop loss price
//if (strategy.position_size > 0)
//    strategy.exit(id="Long Stop", stop=longStopPrice)

//if (strategy.position_size < 0)
//    strategy.exit(id="Short Stop", stop=shortStopPrice)

backtest_timeframe_start = input(defval = timestamp("01 Apr 2016 13:30 +0000"), title = "Backtest Start Time")
USE_ENDTIME = input(false,title="Define the ending period for backtests (If false, will test up to most recent candle)")
backtest_timeframe_end = input(defval = timestamp("19 Mar 2021 19:30 +0000"), title = "Backtest End Time")
TARGET_PROFIT_MODE = input(false,title="Exit when Risk:Reward met")
REWARD_RATIO = input(3,title="Risk:[Reward] (i.e. 3) for exit")
// Trailing stop loss {
TSL_ON = input(true,title="Use trailing stop loss")
var entry_price = float(0)
ATR_multi_len = 26
ATR_multi = input(2, "ATR multiplier for stop loss")
ATR_buffer = ta.atr(ATR_multi_len) * ATR_multi
plotchar(ATR_buffer, "ATR Buffer", "A", location = location.top)
risk_reward_buffer = (ta.atr(ATR_multi_len) * ATR_multi) * REWARD_RATIO
take_profit_long = low > entry_price + risk_reward_buffer
take_profit_short = low < entry_price - risk_reward_buffer
var trailing_SL_buffer = float(0)
var stop_loss_price = float(0)
stop_loss_price := math.max(stop_loss_price, close - trailing_SL_buffer)
// plot TSL line
trail_profit_line_color = color.green
if strategy.position_size == 0  or not TSL_ON
    trail_profit_line_color := color.black
    stop_loss_price := close - trailing_SL_buffer
plot(stop_loss_price,color=trail_profit_line_color)
// }

if true
    buy_condition = openlong
    exit_condition = exitlong
    //ENTRY:
    if buy_condition
        if strategy.position_size == 0
            entry_price := close
            trailing_SL_buffer := ATR_buffer
            stop_loss_price := close - ATR_buffer

        msg = "entry"
        if strategy.position_size > 0
            msg := "pyramiding"
        strategy.entry("Long",strategy.long, comment=msg)

    //EXIT:
    // Case (A) hits trailing stop
    if TSL_ON and strategy.position_size > 0 and close <= stop_loss_price
        if close > entry_price
            strategy.close("Long", comment="take profit [trailing]")
        else if close <= entry_price
            strategy.close("Long", comment="stop loss")
    // Case (B) take targeted profit relative to risk
    if strategy.position_size > 0 and TARGET_PROFIT_MODE
        if take_profit_long
            strategy.close("Long", comment="take profits [risk:reward]")
    // Case (C)
    if strategy.position_size > 0 and exit_condition
        if take_profit_long
            strategy.close("Long", comment="exit[rsi]")