Stratégie de trading multi-périodes basée sur un indicateur de volatilité et un indicateur stochastique
Aperçu
Cette stratégie combine l’indicateur de volatilité VIX et l’indicateur aléatoire RSI, en utilisant une combinaison d’indicateurs de différentes périodes de temps, pour réaliser une position de rupture très efficace et un arrêt de perte d’achat et de vente excessive. Il y a beaucoup de place pour l’optimisation de la stratégie, qui peut s’adapter à différents environnements de marché.
Principe de stratégie
Calculer l’indicateur de volatilité VIX: calculer la volatilité en prenant le prix le plus élevé et le prix le plus bas des 20 derniers jours. Lorsque la volatilité est supérieure à la trajectoire ascendante, cela indique la panique du marché; lorsque elle est inférieure à la trajectoire descendante, cela indique la complaisance du marché.
Calculer l’indicateur RSI au hasard: les hauts et les bas des 14 derniers jours sont calculés. Si le RSI est supérieur à 70, il s’agit d’une zone d’achat excessif et si il est inférieur à 30, il s’agit d’une zone de vente excessive.
Fusion des deux indicateurs, faire plus lorsque la volatilité est supérieure à la trajectoire ou au pourcentage maximum; plafonner lorsque le RSI est supérieur à 70
Avantages stratégiques
- La fusion de plusieurs indicateurs pour une analyse globale du marché.
- Les différentes périodes de temps sont vérifiées les unes par les autres, ce qui améliore la précision de la prise de décision.
- Les paramètres d’ajustement peuvent être optimisés pour s’adapter à différentes variétés de transactions.
Analyse des risques
- Une mauvaise configuration des paramètres peut entraîner plusieurs faux signaux.
- Les indices de plage unique sont faciles à détecter.
Conseils d’optimisation
- Ajout d’indicateurs de vérification supplémentaires, tels que la moyenne, la courbe de Bryn et d’autres pour déterminer le moment de l’entrée.
- Ajout d’autres indicateurs de plage, tels que l’inversion de la forme de la ligne K.
Résumer
Cette stratégie utilise l’indicateur VIX pour déterminer le moment et le niveau de risque du marché, en combinaison avec l’indicateur RSI pour filtrer les points de transaction défavorables de survente et de survente, afin de pouvoir acheter et arrêter les pertes à des moments efficaces. La stratégie a plus de marge d’optimisation et peut s’adapter à un environnement de marché plus large.
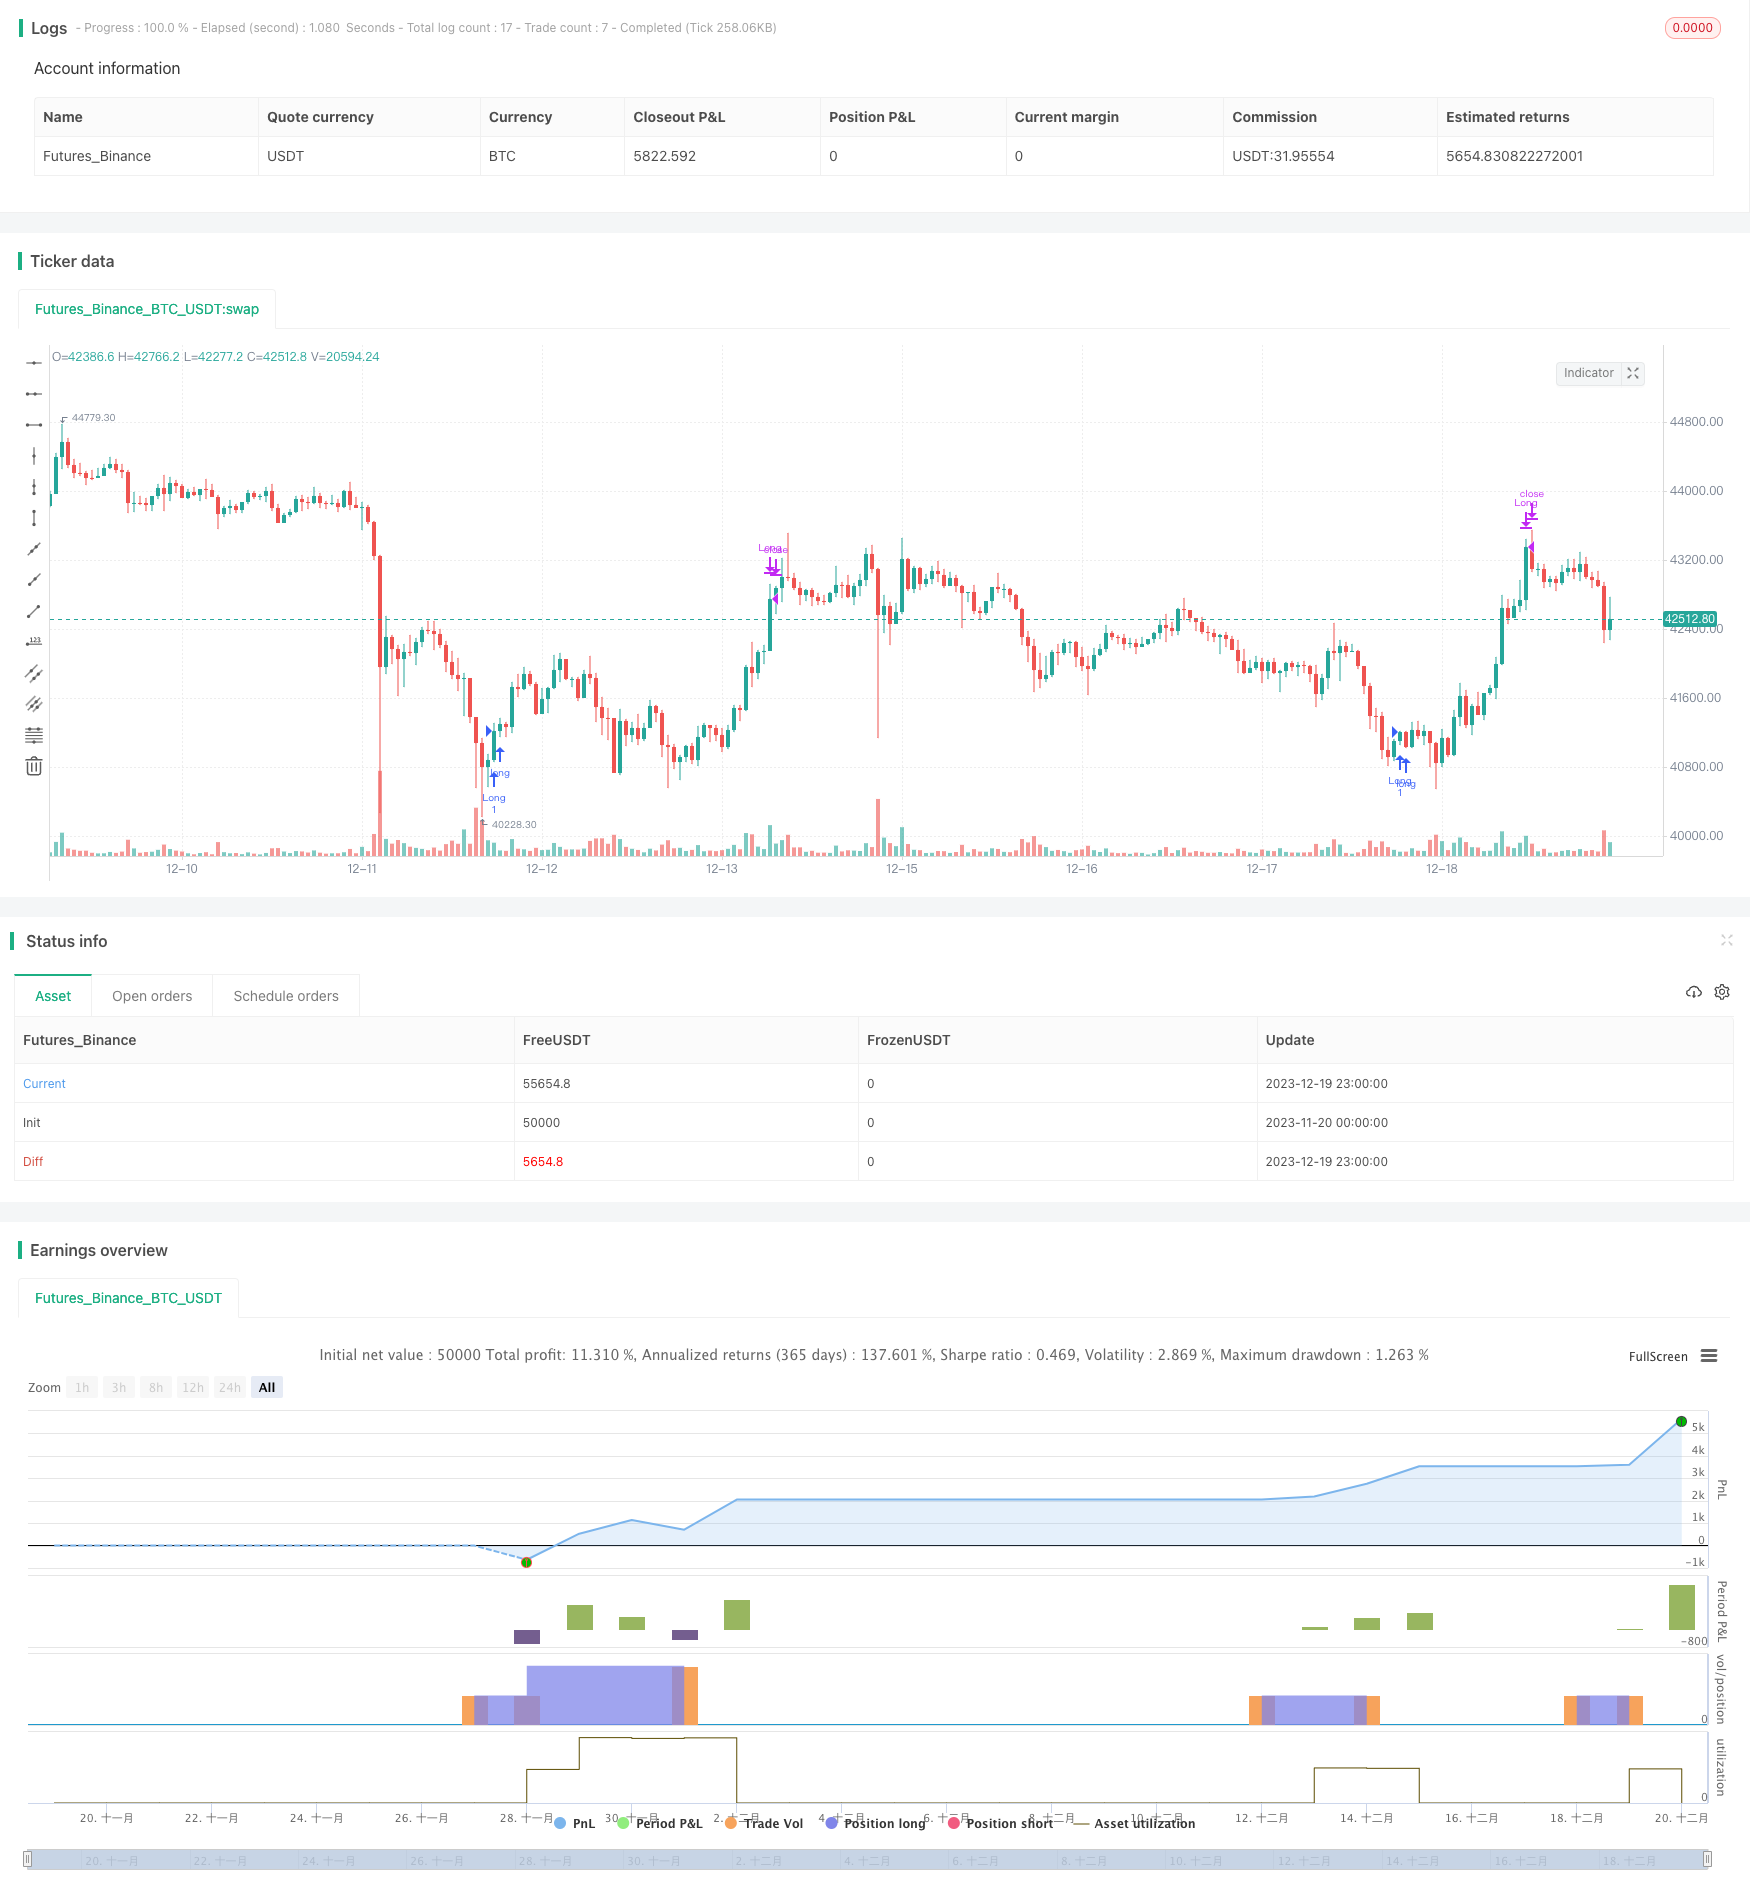
/*backtest
start: 2023-11-20 00:00:00
end: 2023-12-20 00:00:00
period: 1h
basePeriod: 15m
exchanges: [{"eid":"Futures_Binance","currency":"BTC_USDT"}]
*/

//@version=5
// This source code is subject to the terms of the Mozilla Public License 2.0 at https://mozilla.org/MPL/2.0/
// © timj

strategy('Vix FIX / StochRSI Strategy', overlay=true, pyramiding=9, margin_long=100, margin_short=100)

Stochlength = input.int(14, minval=1, title="lookback length of Stochastic")
StochOverBought = input.int(80, title="Stochastic overbought condition")
StochOverSold = input.int(20, title="Stochastic oversold condition")
smoothK = input(3, title="smoothing of Stochastic %K ")
smoothD = input(3, title="moving average of Stochastic %K")
k = ta.sma(ta.stoch(close, high, low, Stochlength), smoothK)
d = ta.sma(k, smoothD)

///////////// RSI
RSIlength = input.int( 14, minval=1 , title="lookback length of RSI")
RSIOverBought = input.int( 70  , title="RSI overbought condition")
RSIOverSold = input.int( 30  , title="RSI oversold condition")
RSIprice = close
vrsi = ta.rsi(RSIprice, RSIlength)

///////////// Double strategy: RSI strategy + Stochastic strategy

pd = input(22, title="LookBack Period Standard Deviation High")
bbl = input(20, title="Bolinger Band Length")
mult = input.float(2.0    , minval=1, maxval=5, title="Bollinger Band Standard Devaition Up")
lb = input(50  , title="Look Back Period Percentile High")
ph = input(.85, title="Highest Percentile - 0.90=90%, 0.95=95%, 0.99=99%")
new = input(false, title="-------Text Plots Below Use Original Criteria-------" )
sbc = input(false, title="Show Text Plot if WVF WAS True and IS Now False")
sbcc = input(false, title="Show Text Plot if WVF IS True")
new2 = input(false, title="-------Text Plots Below Use FILTERED Criteria-------" )
sbcFilt = input(true, title="Show Text Plot For Filtered Entry")
sbcAggr = input(true, title="Show Text Plot For AGGRESSIVE Filtered Entry")
ltLB = input.float(40, minval=25, maxval=99, title="Long-Term Look Back Current Bar Has To Close Below This Value OR Medium Term--Default=40")
mtLB = input.float(14, minval=10, maxval=20, title="Medium-Term Look Back Current Bar Has To Close Below This Value OR Long Term--Default=14")
str = input.int(3, minval=1, maxval=9, title="Entry Price Action Strength--Close > X Bars Back---Default=3")
//Alerts Instructions and Options Below...Inputs Tab
new4 = input(false, title="-------------------------Turn On/Off ALERTS Below---------------------" )
new5 = input(false, title="----To Activate Alerts You HAVE To Check The Boxes Below For Any Alert Criteria You Want----")
sa1 = input(false, title="Show Alert WVF = True?")
sa2 = input(false, title="Show Alert WVF Was True Now False?")
sa3 = input(false, title="Show Alert WVF Filtered?")
sa4 = input(false, title="Show Alert WVF AGGRESSIVE Filter?")

//Williams Vix Fix Formula
wvf = ((ta.highest(close, pd)-low)/(ta.highest(close, pd)))*100
sDev = mult * ta.stdev(wvf, bbl)
midLine = ta.sma(wvf, bbl)
lowerBand = midLine - sDev
upperBand = midLine + sDev
rangeHigh = (ta.highest(wvf, lb)) * ph

//Filtered Bar Criteria
upRange = low > low[1] and close > high[1]
upRange_Aggr = close > close[1] and close > open[1]
//Filtered Criteria
filtered = ((wvf[1] >= upperBand[1] or wvf[1] >= rangeHigh[1]) and (wvf < upperBand and wvf < rangeHigh))
filtered_Aggr = (wvf[1] >= upperBand[1] or wvf[1] >= rangeHigh[1]) and not (wvf < upperBand and wvf < rangeHigh)

//Alerts Criteria
alert1 = wvf >= upperBand or wvf >= rangeHigh ? 1 : 0
alert2 = (wvf[1] >= upperBand[1] or wvf[1] >= rangeHigh[1]) and (wvf < upperBand and wvf < rangeHigh) ? 1 : 0
alert3 = upRange and close > close[str] and (close < close[ltLB] or close < close[mtLB]) and filtered ? 1 : 0
alert4 = upRange_Aggr and close > close[str] and (close < close[ltLB] or close < close[mtLB]) and filtered_Aggr ? 1 : 0

//Coloring Criteria of Williams Vix Fix
col = wvf >= upperBand or wvf >= rangeHigh ? color.lime : color.gray

isOverBought = (ta.crossover(k,d) and k > StochOverBought) ? 1 : 0
isOverBoughtv2 = k > StochOverBought ? 1 : 0
filteredAlert = alert3 ? 1 : 0
aggressiveAlert = alert4 ? 1 : 0


if (filteredAlert or aggressiveAlert)
    strategy.entry("Long", strategy.long)

if (isOverBought)
    strategy.close("Long")