Stratégie de tendance quantitative JBravo
Aperçu de la stratégie
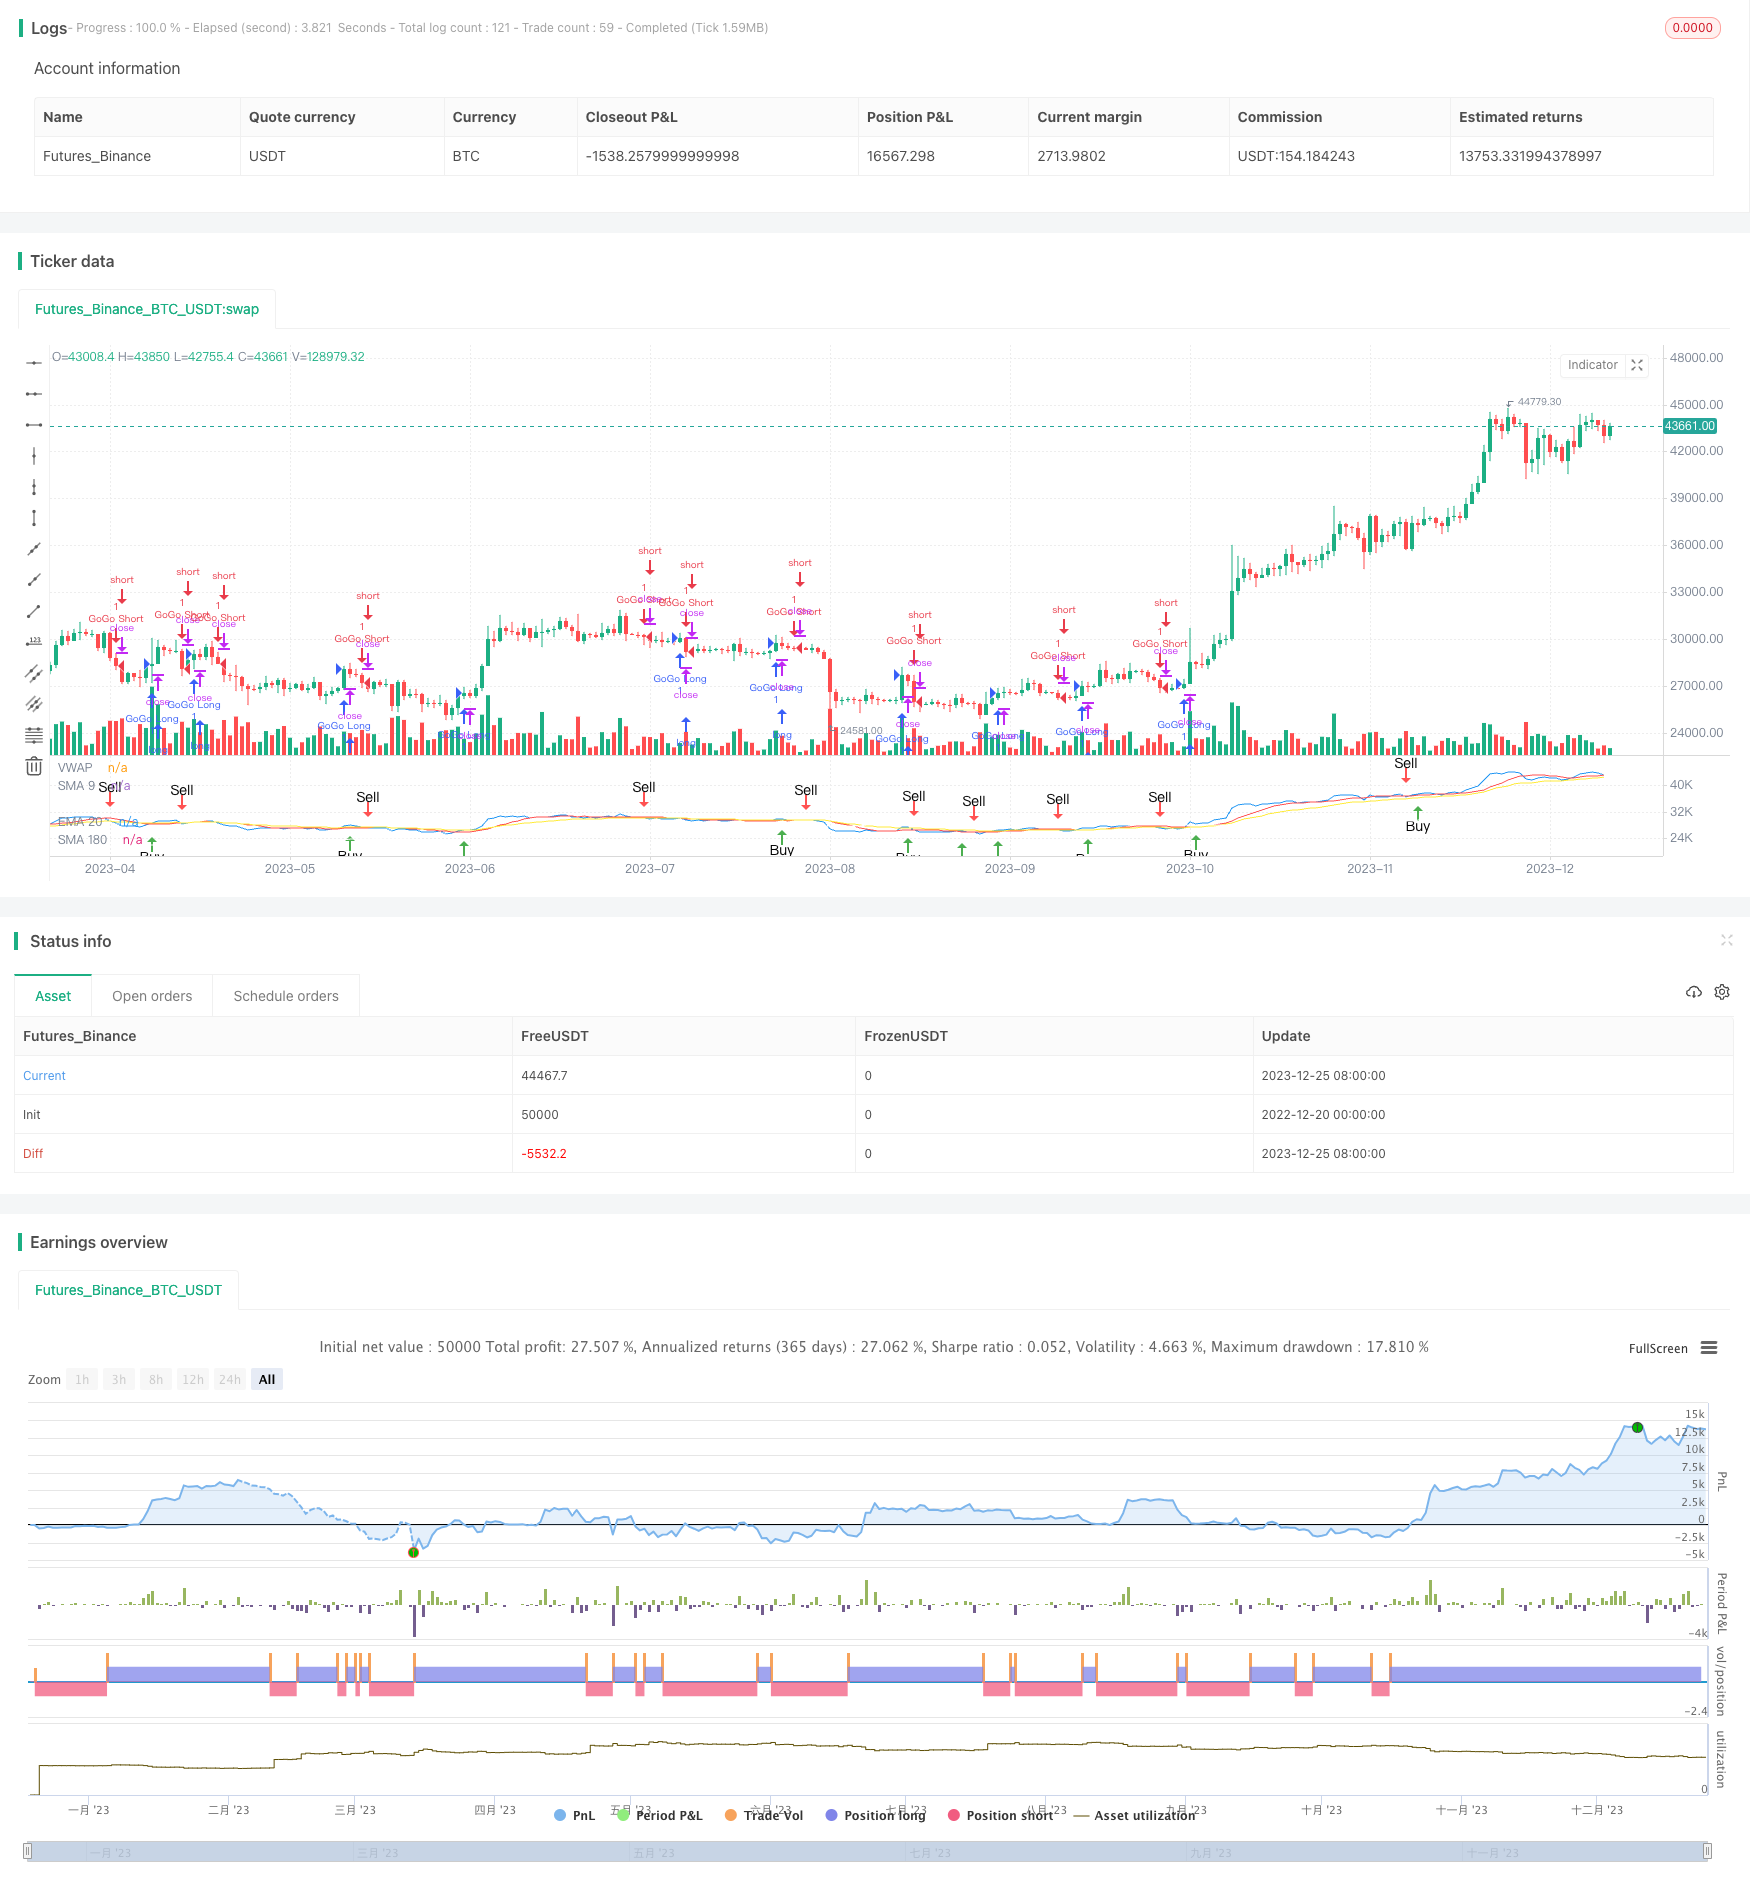
La stratégie de tendance quantifiée de JBravo est une stratégie de suivi de tendance basée sur les moyennes mobiles. Elle utilise les moyennes mobiles simples de 9 jours, les moyennes mobiles indicielles de 20 jours et les moyennes mobiles simples de 180 jours pour juger de la direction de la tendance du marché et des signaux d’achat et de vente finaux.
Le nom de la stratégie a été inspiré par le personnage de Johnny Bravo, un personnage animé qui représente une décision de transaction confiante et décisive. Le vocabulaire “ GoGo Juice ” décrit l’entrée en scène lorsque la ligne VWAP traverse l’indice des moyennes mobiles sur 20 jours.
Principe de stratégie
Un signal de vente est généré lorsque le prix de clôture d’une ligne K traverse la moyenne mobile simple de 9 jours; un signal de vente est généré lorsque le prix de clôture de la ligne K traverse la moyenne mobile indicielle de 20 jours.
Si les moyennes mobiles des 9, 20 et 180 jours sont toutes à la hausse et que la moyenne mobile du 9 est supérieure à la moyenne mobile du 20 et que la moyenne mobile du 20 est supérieure à la moyenne mobile du 180 jours, un fort signal d’achat est généré.
Si les moyennes mobiles des 9, 20 et 180 jours sont toutes à la baisse et que la moyenne mobile du 9 est inférieure à la moyenne mobile du 20 et que la moyenne mobile du 20 est inférieure à la moyenne mobile du 180 jours, un fort signal de vente est généré.
Un signal de baisse de GoGo est généré lorsque la ligne de prix moyenne pondérée de transaction traverse la moyenne mobile de l’indice à 20 jours de manière descendante; un signal de baisse de GoGo est généré lorsque la ligne de prix moyenne pondérée de transaction traverse la moyenne mobile de l’indice à 20 jours de manière descendante.
Analyse des forces stratégiques
Cette stratégie combine le suivi de la tendance et la stratégie de la rupture. La moyenne mobile permet de déterminer clairement la direction de la tendance du marché et réduit la probabilité d’erreurs de transaction. En même temps, elle utilise de manière flexible l’indicateur de la valeur moyenne pondérée en volume de transaction pour déterminer le moment d’entrée, tout en optimisant la rupture du marché.
Par rapport à l’utilisation de la moyenne mobile seule, cette stratégie ajoute un mécanisme d’entrée de jeu actif, le GoGo, qui permet d’obtenir un taux de rendement plus élevé sur le marché en cas de forte tendance.
Dans l’ensemble, le retrait est faible et la rentabilité stable.
Analyse stratégique des risques
Bien que la stratégie ajoute un mécanisme d’entrée fort, les points de rupture peuvent être fréquemment déclenchés dans des conditions de choc. De plus, les moyennes mobiles elles-mêmes sont très retardées et ne peuvent pas capturer les variations de prix en temps opportun.
Cela signifie que la stratégie peut générer un certain nombre de transactions virtuelles qui ne reflètent pas réellement les prix du marché. De plus, une entrée forte augmente le risque de pertes.
Pour réduire le risque, il est possible d’ajuster la périodicité des moyennes mobiles; ou d’ajouter un module d’arrêt de perte pour arrêter les pertes et les retirer après que les pertes aient atteint une certaine amplitude.
Orientation de l’optimisation de la stratégie
Cette stratégie peut être optimisée dans les directions suivantes:
Ajuster les paramètres de la moyenne mobile, optimiser les paramètres de la période et trouver la meilleure combinaison de paramètres
Augmenter le jugement sur les indicateurs de transaction afin d’éviter les signaux erronés lors de fortes fluctuations des prix
Ajout d’un module de stop loss, réglementation des règles de sortie et contrôle des pertes individuelles
La stratégie est plus ciblée en combinant la sélection des secteurs les plus populaires du marché.
Optimiser le ratio des positions ouvertes, optimiser les différents paramètres pour différentes positions à échelle
Résumer
La stratégie de tendance quantitative de JBravo intègre l’analyse des moyennes mobiles et la détermination de la tendance des prix moyens pondérés par le volume de transactions. Elle cherche à obtenir des bénéfices sur les longues lignes stables, tout en disposant d’un mécanisme de négociation dynamique.
||
Strategy Overview
The JBravo Quantitative Trend Strategy is a trend-following strategy based on moving averages. It uses the 9-day simple moving average, 20-day exponential moving average, and 180-day simple moving average to determine the market trend direction, as well as the final buy and sell signals.
The strategy name is inspired by the cartoon character Johnny Bravo, representing a confident and decisive trading decision. The term “GoGo Juice” depicts the aggressive entry when the VWAP line crosses the 20-day exponential moving average.
Strategy Principle
A buy signal is generated when the closing price crosses above the 9-day simple moving average; A sell signal is generated when the closing price crosses below the 20-day exponential moving average.
If the 9-day, 20-day and 180-day moving averages are all moving up, and the 9-day moving average is above the 20-day moving average, the 20-day moving average is above the 180-day moving average, a strong buy signal is generated.
If the 9-day, 20-day and 180-day moving averages are all moving down, and the 9-day moving average is below the 20-day moving average, the 20-day moving average is below the 180-day moving average, a strong sell signal is generated.
When the Volume Weighted Average Price line crosses the 20-day exponential moving average upward, a “GoGo Long” signal is generated; When the Volume Weighted Average Price line crosses the 20-day exponential moving average downward, a “GoGo Short” signal is generated.
Advantage Analysis
This strategy combines the ideas of trend following and breakout strategies. Moving averages can clearly determine the direction of the market trend and reduce the probability of wrong trades. At the same time, it flexibly uses the VWAP indicator to determine the entry time, controlling risks while favoring breakthroughs in the market.
Compared to using moving averages alone, this strategy adds the aggressive entry mechanism of “GoGo Juice”, which can obtain higher returns in strong trends.
Overall, this strategy has small drawdowns and stable profitability.
Risk Analysis
Although the strategy increases the strength of entries, stop loss points can be frequently triggered in sideways markets. In addition, moving averages themselves have high inertia and cannot keep up with price changes in time.
This means that the strategy may generate a certain number of virtual trades that do not actually reflect market price movements. In addition, aggressive entries also increase the risk of losses.
To reduce risks, we can adjust the cycle of moving averages as appropriate; or add a stop loss module to stop loss when losses reach a certain level.
Optimization Directions
The strategy can be optimized in the following directions:
Adjust moving average parameters and optimize cycle parameters to find the optimal parameter combination
Add volume indicators to avoid false signals in times of violent price fluctuations
Increase stop loss modules and set exit rules to control per trade loss
Combine selections of market hot sectors to make strategies more targeted
Optimize opening position proportions, optimize different scale for different parameters
Conclusion
The JBravo Quantitative Trend Strategy integrates moving average analysis and VWAP trend judgment. It pursues stable long-term profits while having a certain degree of aggressive trading mechanisms. The strategy is suitable for medium-long term holdings, with medium-high risks and high returns. It can become a part of portfolio trading strategies with very good market adaptability.
[/trans]
/*backtest
start: 2022-12-20 00:00:00
end: 2023-12-26 00:00:00
period: 1d
basePeriod: 1h
exchanges: [{"eid":"Futures_Binance","currency":"BTC_USDT"}]
*/

// This source code is subject to the terms of the Mozilla Public License 2.0 at https://mozilla.org/MPL/2.0/
// © bradvaughn

//@version=4
strategy("JBravo Swing", overlay = false)

var buy_in_progress = false


//Moving Averages
smaInput1 = input(title="Display SMA 9", type=input.bool, defval=true)
smaInput2 = input(title="Display EMA 20", type=input.bool, defval=true)
smaInput4 = input(title="Display SMA 180", type=input.bool, defval=true)
colored_180 = input(false, title="Color-code 180 trend direction")
vwapInput = input(title="Display VWAP", type=input.bool, defval=true)

sma9 = sma(close, 9)
ema20 = ema(close, 20)
sma180 = sma(close, 180)

//Plot Moving Averages
plot(smaInput1 ? sma9 : na, color= color.red, title="SMA 9")
plot(smaInput2 ? ema20 : na, color = color.yellow, title="EMA 20")

// Plot VWAP
vwap1 = vwap(hlc3)
plot(vwapInput ? vwap1 : na, color = color.blue, title="VWAP")
vwaplong = vwap1 > ema20
vwapshort = vwap1 < ema20

//Color SMA 180 trend direction if selected
sma180_uptrend = sma(close, 180) > sma(close[2], 180)
colr = sma180_uptrend == true or colored_180 == false ? color.white : colored_180 == true ? color.gray : na
plot(smaInput4 ? sma180 : na, color = colr, title="SMA 180")

//Get value of lower end of candle
buyLow = iff(lowest(open, 1) < lowest(close, 1), lowest(open, 1), lowest(close, 1))
sellLow = lowest(close, 1)

// Find the lower MA for crossover sell condition
sellma = iff((sma9<ema20), sma9, ema20)


//SMA 9 trend direction
sma9_uptrend = sma(close, 9) > sma(close[2], 9)
//EMA 20 trend direction
ema20_uptrend = ema(close, 20) > sma(close[2], 20)

//Buy or sell if conditions are met
// Buy when the candle low is above the SMA9
// Sell when the candle low is below the lower of SMA9 and EMA20
Buy = iff(buy_in_progress == false and buyLow > sma9 == true, true, false)
Sell = iff(buy_in_progress == true and sellLow < sellma == true, true, false)

// Determine stong buy and strong sell conditions.
// If moving averages are all up, then this will qualify a buy as a strong buy.
// If the moving averages are not up (ie. down) then this will qualify a sell as a strong sell
StrongBuy = iff (Buy and sma9_uptrend and sma180_uptrend and ema20_uptrend and (sma9 > ema20) and (ema20 > sma180), true, false)
StrongSell = iff (Sell and not sma9_uptrend and not sma180_uptrend and not ema20_uptrend and (sma9 < ema20) and (ema20 < sma180), true, false)

//Update Trading status if bought or sold
if Buy
    buy_in_progress := true
if Sell
    buy_in_progress := false

// Clear Buy and Sell conditions if StrongBuy or StrongSell conditions exist.
// This disables plotting Buy and Sell conditions
if StrongBuy
    Buy := false
if StrongSell
    Sell := false


//Display BUY/SELL indicators

plotshape(Buy,title="Buy", color=color.green, style=shape.arrowup,location=location.belowbar, text="Buy")
plotshape(StrongBuy,title="Strong Buy", color=color.green, style=shape.arrowup,location=location.belowbar, text="Strong Buy")
plotshape(Sell,title="Sell", color=color.red, style=shape.arrowdown,text="Sell")
plotshape(StrongSell,title="Strong Sell", color=color.red, style=shape.arrowdown,text="Strong Sell")

strategy.entry("GoGo Long", strategy.long, 1, when=vwaplong and vwapInput)
strategy.entry("GoGo Short", strategy.short, 1, when=vwapshort and vwapInput)

strategy.close("GoGo Long", when = vwapshort and vwapInput)
strategy.close("GoGo Short", when = vwaplong and vwapInput)


alertcondition(Buy, title="Buy Signal", message="Buy")
alertcondition(Sell, title="Sell Signal", message="Sell")