Stratégie de tendance quantitative combinant plusieurs facteurs
Aperçu
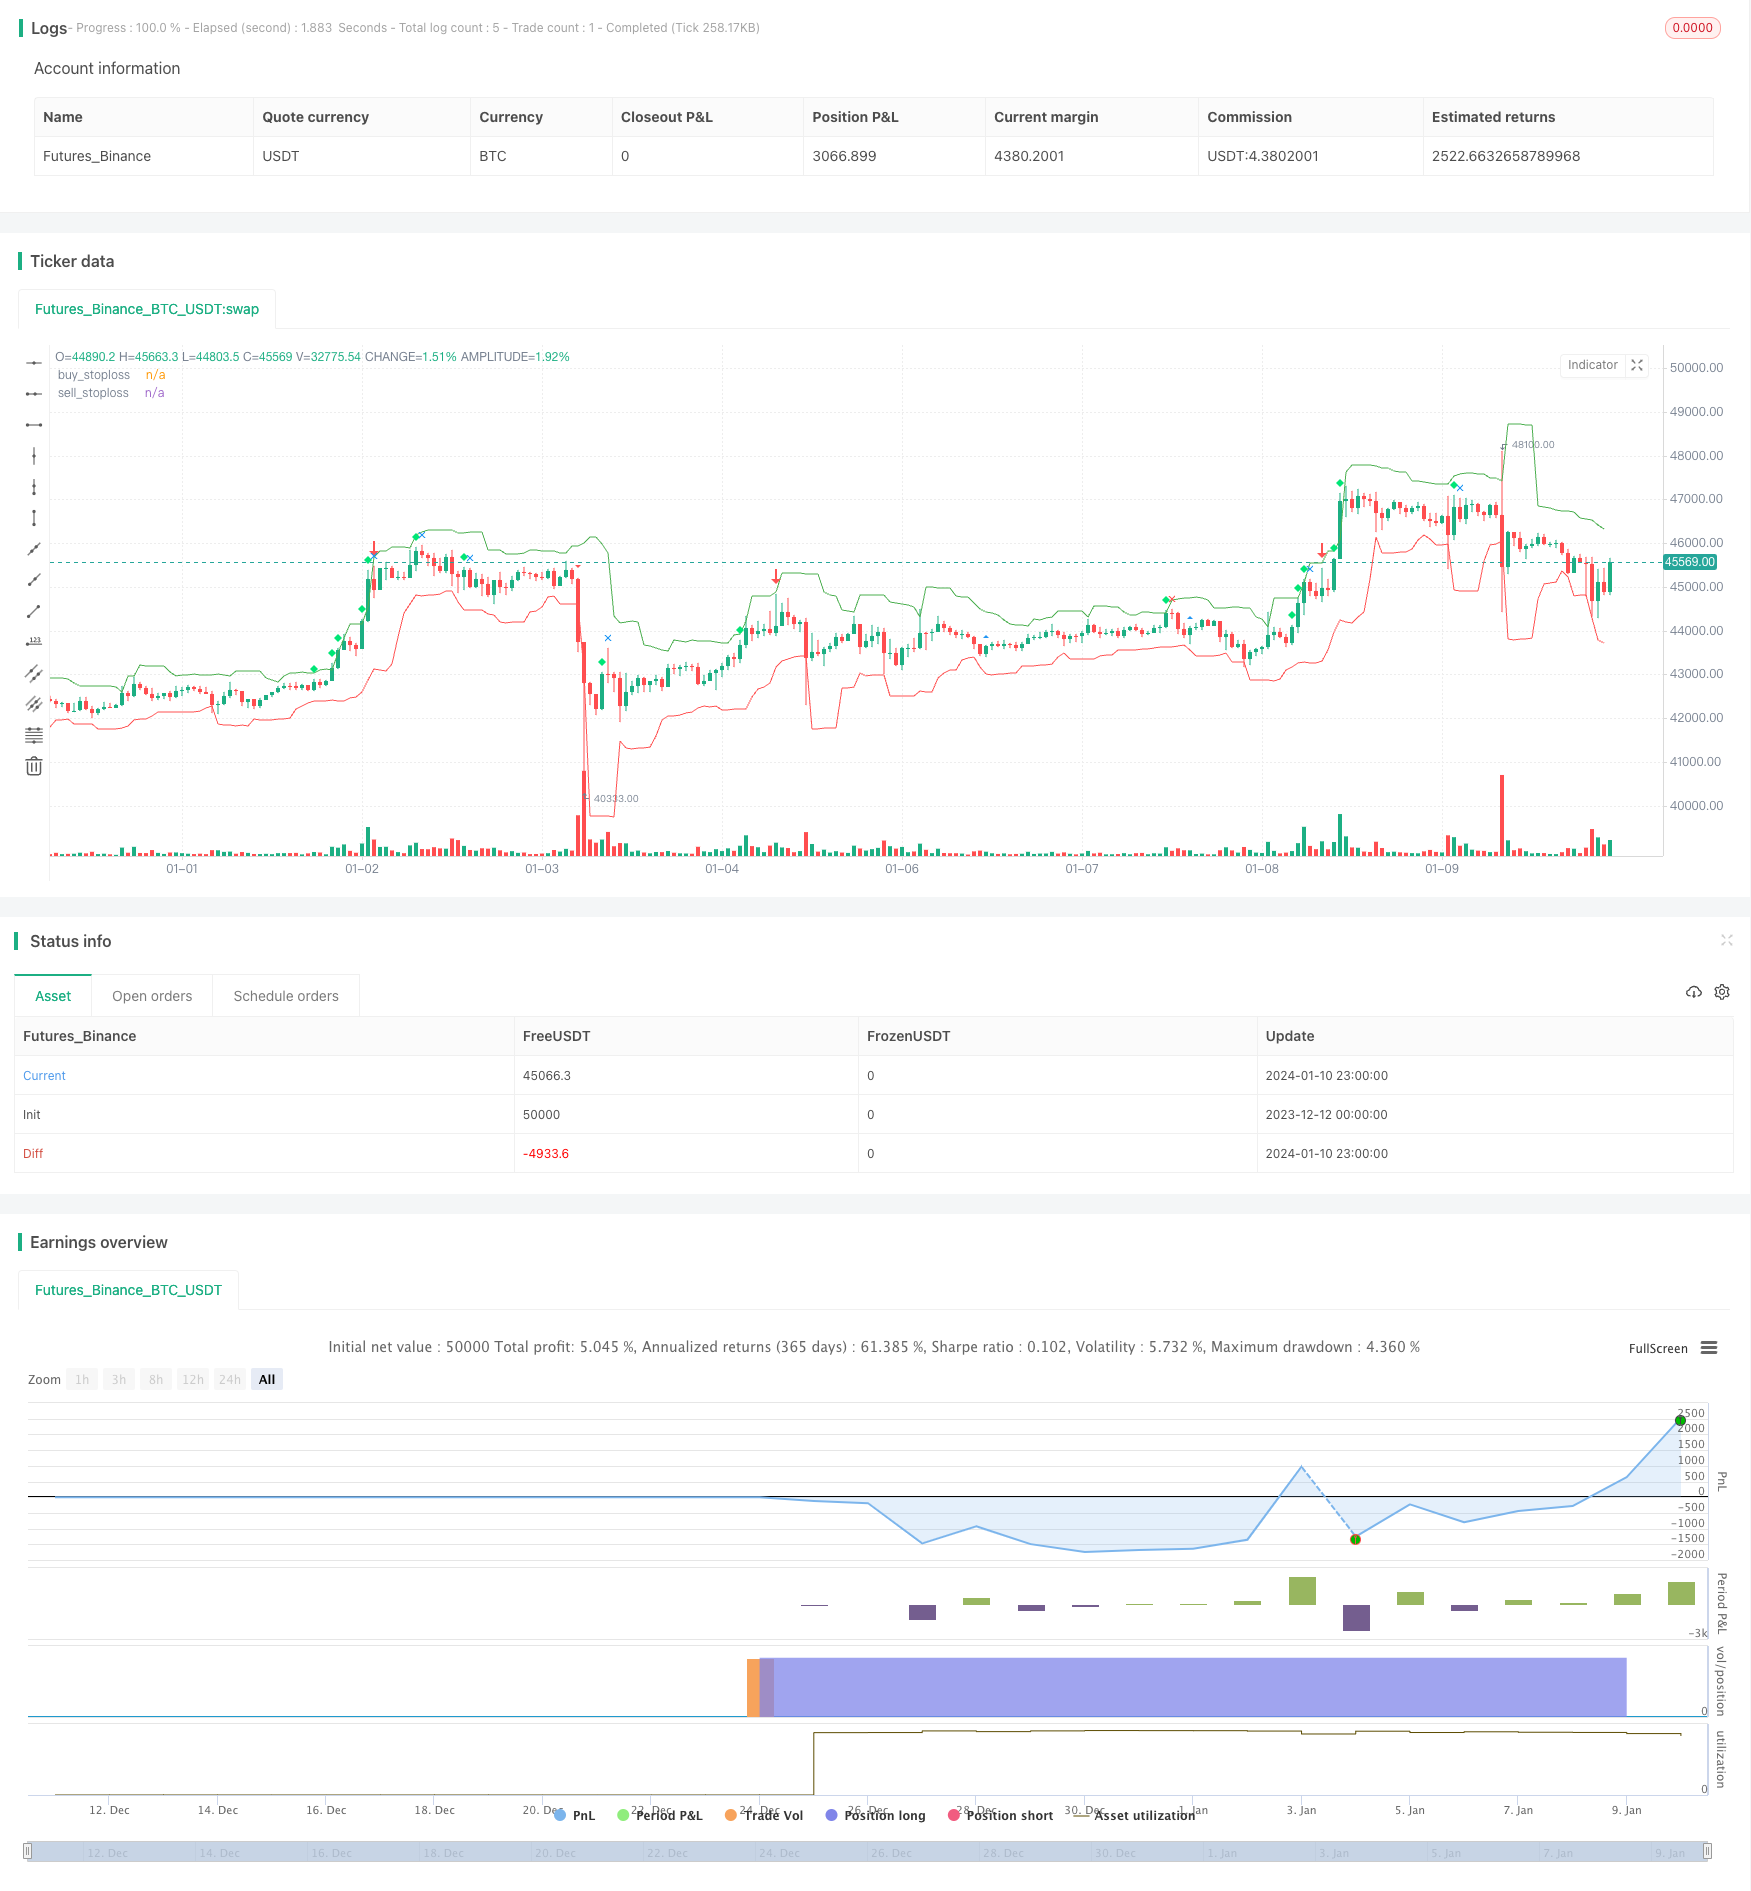
Cette stratégie intégrée prend en compte plusieurs facteurs, tels que le volume de transactions, la volatilité, la position de clôture, la tendance, etc., pour identifier les opportunités de transactions, et fait partie d’une stratégie quantifiée typique à plusieurs facteurs.
Principe de stratégie
L’idée centrale de cette stratégie est de combiner plusieurs facteurs, tels que la rupture anormale du volume, la position de clôture et la marge de fluctuation, pour identifier les points d’achat et de vente.
En particulier, la stratégie calcule le volume moyen des transactions au cours de la période écoulée, et une rupture anormale du volume des transactions dans le cycle actuel peut indiquer un changement de tendance. De plus, si le prix de clôture est proche du bord supérieur ou inférieur de l’amplitude de fluctuation, cela signifie que la tendance actuelle peut être inversée.
Pour vérifier le point d’achat et de vente, la stratégie s’appuie également sur l’indicateur d’amplitude de fluctuation. Si la fluctuation dépasse la moyenne de la période précédente, un signal d’achat est généré. Ensuite, si le prix de clôture d’un cycle ascendant se situe dans la deuxième moitié de l’amplitude de fluctuation et que le volume de transactions augmente, un signal de vente est généré.
En outre, la stratégie est combinée avec un indicateur de la ligne moyenne pour déterminer la tendance globale, et si une variation de tendance se produit sur la ligne moyenne et longue, elle est également utilisée comme condition pour générer un signal d’achat ou de vente.
En combinant ces différents indicateurs, cette stratégie permet de juger de manière globale du moment où le marché est en train de s’acheter ou de se vendre.
Avantages stratégiques
Le principal avantage de cette stratégie est qu’elle prend en compte de multiples facteurs pour rendre les décisions plus fiables. Plus précisément, il y a principalement les avantages suivants:
- En tenant compte de la rupture du trafic, il est possible de détecter à l’avance les signes d’un changement de tendance.
- Il est important d’être à l’écoute des tendances réelles, et de ne pas se laisser induire en erreur par le bruit des marchés à court terme.
- Le cours moyen et le cours moyen à long terme sont combinés pour déterminer la direction de la tendance globale et s’assurer que la stratégie est conforme à la tendance des marchés majeurs.
- Le jugement global multifactoriel rend la stratégie plus stable et plus fiable, et évite de grandes pertes.
Risque stratégique
Cette stratégie comporte également des risques à prendre en compte:
- La combinaison de plusieurs facteurs rend le jugement plus compliqué et le paramétrage plus difficile.
- Il n’est pas possible d’éviter complètement les transactions inutiles générées par de faux piratages.
- L’efficacité de l’ensemble de l’opération est réduite si la tendance dominante est mal évaluée.
- Les paramètres de volatilité doivent être ajustés en fonction des différentes conditions du marché.
Direction d’optimisation
Les principales améliorations apportées à cette stratégie sont les suivantes:
- Optimiser automatiquement les paramètres à l’aide de méthodes telles que l’apprentissage automatique.
- Adhérer à une stratégie de gestion des risques de Stop Loss.
- Les tendances dominantes sont déterminées en combinant d’autres facteurs, tels que les flux de capitaux.
- La conception s’adapte aux paramètres de fluctuation.
Résumer
La stratégie prend en compte de multiples facteurs pour identifier les opportunités de trading. L’avantage de la stratégie réside dans le fait qu’elle est globale et fiable. Le principal risque réside dans la détermination des paramètres et l’erreur de jugement des tendances principales.
/*backtest
start: 2023-12-12 00:00:00
end: 2024-01-11 00:00:00
period: 1h
basePeriod: 15m
exchanges: [{"eid":"Futures_Binance","currency":"BTC_USDT"}]
*/

//@version=3
strategy("volume spread analysis ", overlay=true)

volavg = sma(volume,40)
c= close
l=low
h=high
v=volume

volmean 			= 	stdev(volavg,30)
volupband3 			= 	volavg + 3*volmean
volupband2 			= 	volavg + 2*volmean
volupband1 			= 	volavg + 1*volmean
voldnband1 			= 	volavg -1*volmean
voldnband2 			= 	volavg -2*volmean
midprice			=	(high+low)/2
spread				=	(high-low)
avgspread			=	sma(spread,80)
avgspreadbar     	=   spread > avgspread
widerangebar		=	spread>(1.5*avgspread)
narrowrangebar	    =	spread<(0.7*avgspread)
lowvolume			=	volume<volume[1] and volume<volume[2]
upbar				=	close>close[1]
downbar			    =	close<close[1]
highvolume			=	volume>volume[1] and volume[1]>volume[2]
closefactor		    =	close-low
clsposition 		=	spread/closefactor

closeposition		=	iff(closefactor==0,avgspread,clsposition)
vb					=	volume>volavg or volume>volume[1]
upclose			    =	close>=((spread*0.7)+low)// close is above 70% of the bar
downclose			=	close<=((spread*0.3)+low)// close is below the 30% of the bar
aboveclose			=	close>((spread*0.5)+low)// close is between 50% and 70% of the bar
belowclose			=	close<((spread*0.5)+low)// close is between 50% and 30% of the bar
midclose			=	close>((spread*0.3)+low) and c<((spread*0.7)+l)// close is between 30% and 70% of the bar
verylowclose		=	closeposition>4//close is below 25% of the bar
veryhighclose		=	closeposition<1.35// close is above 80% of the bar
closepos			= 	iff(close<=((spread*0.2)+low),1,iff(close<=((spread*0.4)+low),2,iff(close<=((spread*0.6)+low),3,iff(close<=((spread*0.8)+low),4,5))))
                    // 1 = downclose, 2 = belowclose, 3 = midclose, 4 = aboveclose, 5 = upclose
volpos				=  	iff(volume>volavg*2,1,iff(volume>volavg*1.3,2,iff(volume>volavg,3,iff(volume<volavg and volume>volavg*0.7,4,5))))
                    //// 1 = very high, 2 = high, 3 = above average, 4 = less than average, 5 = low
freshgndhi          =  close > highestbars(h,5)
freshgndlo          =  close < lowestbars(l,5)


//========================trend estimation =========================
//jtrend=sma(close,5)
//trendlongterm     =  linreg(jtrend,40)
//trendmediumterm   =  linreg(jtrend,10)
//trendshortterm    =  linreg(jtrend,3)
//tls=linreg(jtrend,3)

minperiodsrwist = input(title="short term min periods",  defval=2, minval=1)
maxperiodsrwist = input(title="short term max periods",  defval=8, minval=1)


minperiodsrwilt = input(title="long term min periods",  defval=10, minval=1)
maxperiodsrwilt = input(title="long term max periods",  defval=40, minval=1)

rwhmins = (high - nz(low[minperiodsrwist])) / (atr(minperiodsrwist) * sqrt(minperiodsrwist))
rwhmaxs = (high - nz(low[maxperiodsrwist])) / (atr(maxperiodsrwist) * sqrt(maxperiodsrwist))
rwhs = max( rwhmins, rwhmaxs )

rwlmins = (nz(high[minperiodsrwist]) - low) / (atr(minperiodsrwist) * sqrt(minperiodsrwist))
rwlmaxs = (nz(high[maxperiodsrwist]) - low) / (atr(maxperiodsrwist) * sqrt(maxperiodsrwist))
rwls = max( rwlmins, rwlmaxs )


rwhminl = (high - nz(low[minperiodsrwilt])) / (atr(minperiodsrwilt) * sqrt(minperiodsrwilt))
rwhmaxl = (high - nz(low[maxperiodsrwilt])) / (atr(maxperiodsrwilt) * sqrt(maxperiodsrwilt))
rwhl = max( rwhminl, rwhmaxl )

rwlminl = (nz(high[minperiodsrwilt]) - low) / (atr(minperiodsrwilt) * sqrt(minperiodsrwilt))
rwlmaxl = (nz(high[maxperiodsrwilt]) - low) / (atr(maxperiodsrwilt) * sqrt(maxperiodsrwilt))
rwll = max( rwlminl, rwlmaxl )


ground = rwhs
sky    = rwls
j      = rwhs-rwls
k      = rwhl-rwll
j2     = rwhl
k2     = rwll
ja     = cross(j,1)
jb     = cross(1,j)
jc     = cross(-1,j)
jd     = cross(j,-1)
j2a    = cross(j2,1)
j2b    = cross(1,j2)
k2a    = cross(k2,1)
k2b    = cross(1,k2)
upmajoron   = j > 1 and ja[1]
upmajoroff  = j < 1 and jb[1]
upminoron   = j2 > 1 and j2a[1]
upminoroff  = j2 < 1 and j2b[1]
dnmajoron   = j < -1 and jc[1]
dnmajoroff  = j > -1 and jd[1]
dnminoron   = k2 > 1 and k2a[1]
dnminoroff  = k2 < 1 and k2b[1]
upimd       = iff(ground > 1, 1,0)
dnimd       = iff(sky > 1, 1, 0)
upmajor     = iff(j>1,1,iff(j<(-1),-1,0))
upminor     = iff(j2>1,1,-1)
dnminor     = iff(k2>1,1,-1)
//======================================================================|

Buy_stop = lowest(low[1],5) - atr(20)[1]
plot(Buy_stop, color=red, title="buy_stoploss")
Sell_stop = highest(high[1],5) + atr(20)[1]
plot(Sell_stop, color=green, title="sell_stoploss")

//======================================================================|

//upthrustbar		=	widerangebar and downclose  and upimd==1 and high>high[1]  //wrb and uhs and fresh ground
nut              	=       widerangebar and downclose  and freshgndhi and highvolume // new signal
bc               	=       widerangebar and aboveclose and volume == highest(volume,60) and upmajor==1  // new signal
upthrustbar		=	widerangebar and (closepos==1 or closepos==2) and upminor>0 and high>high[1] and (upimd>0or upmajor>0) and volpos <4// after minor up trend
upthrustbartrue		=	widerangebar and closepos==1 and upmajor>0 and high>high[1] and volpos <4//occurs after a major uptrend
upthrustcond1		=	upthrustbar[1] and downbar and not narrowrangebar
upthrustcond2		=	upthrustbar[1] and downbar and volpos == 2
upthrustcond3		=	upthrustbar and volpos ==1
toprevbar		=	volume[1]>volavg  and upbar[1] and widerangebar[1] and downbar and downclose and widerangebar and upmajor>0 and high==highest(high,10)
pseudoupthrust		=	upbar[1] and high>high[1] and volume[1]>1.5*volavg and downbar and downclose and  not upthrustbar
pseudoutcond		=	pseudoupthrust[1] and downbar and downclose and not upthrustbar
trendchange		=	upbar[1] and high==highest(high,5) and downbar and (downclose or midclose) and volume>volavg and upmajor>0 and upimd>0 and not widerangebar and not pseudoupthrust
nodemandbarut		=	upbar and narrowrangebar and lowvolume and closepos> 3 and ((upminor>0 and upimd>0)or (upminor<0 and upminor>0))//in a up market
nodemandbardt		=	upbar and narrowrangebar and lowvolume and closepos> 3 and (upminor<=0or upimd<=0)// in a down or sidewayss market
nosupplybar		=	downbar and narrowrangebar and lowvolume  and closepos<3 and ((upminor<1 and upimd<1)or (upminor>0 and upimd<1))
lowvoltest		=   	low==lowest(low,5) and upclose and lowvolume//lowvolume and l<low[1] and upclose
lowvoltest1		= 	low==lowest(low,5) and volume<volavg and low<low[1] and upclose and upminor>0 and upmajor>0// and widerangebar
lowvoltest2		= 	lowvoltest[1] and upbar and upclose
sellcond1		=	(upthrustcond1 or upthrustcond2 or upthrustcond3)
sellcond2		=	sellcond1[1]==0
sellcond		=	sellcond1 and sellcond2
strengthdown0		= 	upmajor<0 and volpos<4 and downbar[1] and upbar and closepos>3 and upminor<0 and upimd<=0// strength after a long down trend
strengthdown		= 	volpos<4 and downbar[1] and upbar and closepos>3 and upimd<=00 and upminor<0// strength after a down trend
strengthdown1		= 	upmajor<0 and volume>(volavg*1.5) and downbar[1] and upbar and closepos>3 and upminor<0 and upimd<=0//strength after downtrend . high volume
strengthdown2		=	upimd<=0 and volume[1]<volavg  and upbar and veryhighclose and volpos<4
buycond1		= 	strengthdown or strengthdown1
buycond			= 	upbar  and buycond1[1]
stopvolume		= 	low==lowest(low,5)  and (upclose or midclose) and v>1.5*volavg and upmajor<0
revupthrust		=	upmajor<0 and upbar and upclose and volume>volume[1] and volume>volavg and  widerangebar and downbar[1] and downclose[1] and upminor<0
effortup		=	high>high[1] and low>low[1] and close>close[1] and close>=((high-low)*0.7+low) and spread>avgspread and volpos<4//and open<=((high-low)*0.3+low)
effortupfail		=	effortup[1] and (upthrustbar or upthrustcond1 or upthrustcond2 or upthrustcond3 or (downbar and avgspreadbar))
effortdown		=	high<high[1] and low<low[1] and close<close[1] and  close<=((high-low)*0.25+low) and widerangebar and volume>volume[1]//o>=((high-low)*0.75+
effortdownfail  	=  	effortdown[1] and ((upbar and avgspreadbar)or revupthrust or buycond1)
upflag           	=  	(sellcond or buycond or effortup or effortupfail or stopvolume or effortdown or effortdownfail or revupthrust or nodemandbardt or nodemandbarut or nosupplybar or lowvoltest	or lowvoltest1 or lowvoltest2 or bc)
bullbar			=	(volume>volavg or volume>volume[1]) and closeposition <2 and upbar and not upflag
bearbar			=	vb  and downclose and downbar and spread>avgspread and not upflag
buy =	(upbar and revupthrust[1])or lowvoltest2
burely				=	strengthdown1 and stopvolume[1]or (upbar and revupthrust[1])or lowvoltest2
//buy				=	effortup and lowvoltest2[1]
//sell			=	upthrustbartrue
sell			=	effortup[1] and effortupfail and upthrustcond3 and upthrustbartrue and toprevbar

strategy.entry("simpleBuy", strategy.long, when= (upbar and revupthrust[1])or lowvoltest2 )
strategy.close("simpleBuy",when=upthrustbartrue )

//strategy.entry("simpleSell", strategy.short,when= upthrustbartrue )
//strategy.close("simpleSell",when= (upbar and revupthrust[1])or lowvoltest2)


//|============================================================================================|
//data = close >= open
//plotshape(true, style=shape.flag, color=data ? green : red)

plotshape((upthrustbar or upthrustbartrue)	,title="upthrustbaro"	,style=shape.arrowdown		,size=size.huge,color=red	)
//plotshape(toprevbar					        ,title="toprevbar"  	,style=shape.flag		,size=size.small,color=blue	)
//plotshape((pseudoupthrust)			    	,title="(pseudoupthrus"	,style=shape.circle		,size=size.small,color=blue	)
//plotshape((upthrustcond1 or upthrustcond2)	,title="upthrustcond1"	,style=shape.triangleup		,size=size.small,color=red	)
plotshape(trendchange		    			,title="trendchange"	,style=shape.xcross		,size=size.small,color=red	)
//plotshape((nodemandbardt)		    		,title="(nodemandbardt"	,style=shape.square		,size=size.small,color=orange	)
//plotshape(nosupplybar				    	,title="nosupplybar"	,style=shape.cross		,size=size.small,color=blue)
plotshape(revupthrust				    	,title="revupthrust"	,style=shape.arrowup		,size=size.huge,color=green	)
//plotshape((upthrustbar	or	upthrustbartrue)	,title="upthrustbaro"	,style=shape.cross		,size=size.small,color=red	)
//plotshape((upthrustcond1	or	upthrustcond2)	,title="upthrustcond1"	,style=shape.triangledown	,size=size.small,color=white	)
//plotshape((pseudoupthrust)				,title="(pseudoupthrus"	,style=shape.arrowup		,size=size.small,color=blue	)
//plotshape(nodemandbarut					,title="nodemandbarut"	,style=shape.labelup		,size=size.small,color=orange	)
//plotshape(nodemandbarut					,title="nodemandbarut"	,style=shape.labeldown		,size=size.small,color=yellow	)
//plotshape(nodemandbardt					,title="nodemandbardt"	,style=shape.diamond      	,size=size.small,color=yellow	)
//plotshape(nosupplybar					,title="nosupplybar"	,style=shape.xcross		,size=size.small,color=blue	)
plotshape(lowvoltest					,title="lowvoltest"	,style=shape.triangleup		,size=size.small,color=blue	)
//plotshape(lowvoltest2					,title="lowvoltest2"	,style=shape.triangledown	,size=size.small,color=yellow	)
//plotshape(strengthdown					,title="strengthdown"	,style=shape.flag		,size=size.small,color=green)
//plotshape(strengthdown					,title="strengthdown"	,style=shape.circle		,size=size.small,color=lime	)
//plotshape(strengthdown2					,title="strengthdown2"	,style=shape.arrowup		,size=size.small,color=silver	)
//plotshape(strengthdown2					,title="strengthdown2"	,style=shape.arrowdown		,size=size.small,color=red	)
//plotshape(stopvolume					,title="stopvolume"	,style=shape.labelup		,size=size.small,color=green	)
//plotshape(stopvolume					,title="stopvolume"	,style=shape.labeldown		,size=size.small,color=yellow	)
plotshape(effortup					,title="effortup"	,style=shape.diamond      	,size=size.small,color=lime	)
plotshape(effortupfail					,title="effortupfail"	,style=shape.xcross		,size=size.small,color=blue	)
//plotshape(effortupfail					,title="effortupfail"	,style=shape.cross		,size=size.small,color=white	)
plotshape(effortdown					,title="effortdown"	,style=shape.triangledown		,size=size.small,color=red	)
plotshape(effortdownfail				,title="effortdownfail"	,style=shape.xcross	,size=size.small,color=green	)
//plotshape(effortdownfail				,title="effortdownfail"	,style=shape.flag		,size=size.small,color=white	)
//plotshape(buycond					,title="buycond"	,style=shape.circle		,size=size.small,color=green	)
//plotshape(sellcond					,title="sellcond"	,style=shape.arrowup		,size=size.small,color=orange	)
//plotshape((nut)						,title="(nut)"		,style=shape.arrowdown		,size=size.small,color=lime	)
//plotshape((bc	)					,title="(bc"		,style=shape.labelup		,size=size.small,color=red	)
//plotshape(buy						,title="buy"		,style=shape.labeldown		,size=size.small,color=white	)