Stratégie de trading de l'oscillateur dynamique de momentum
Aperçu
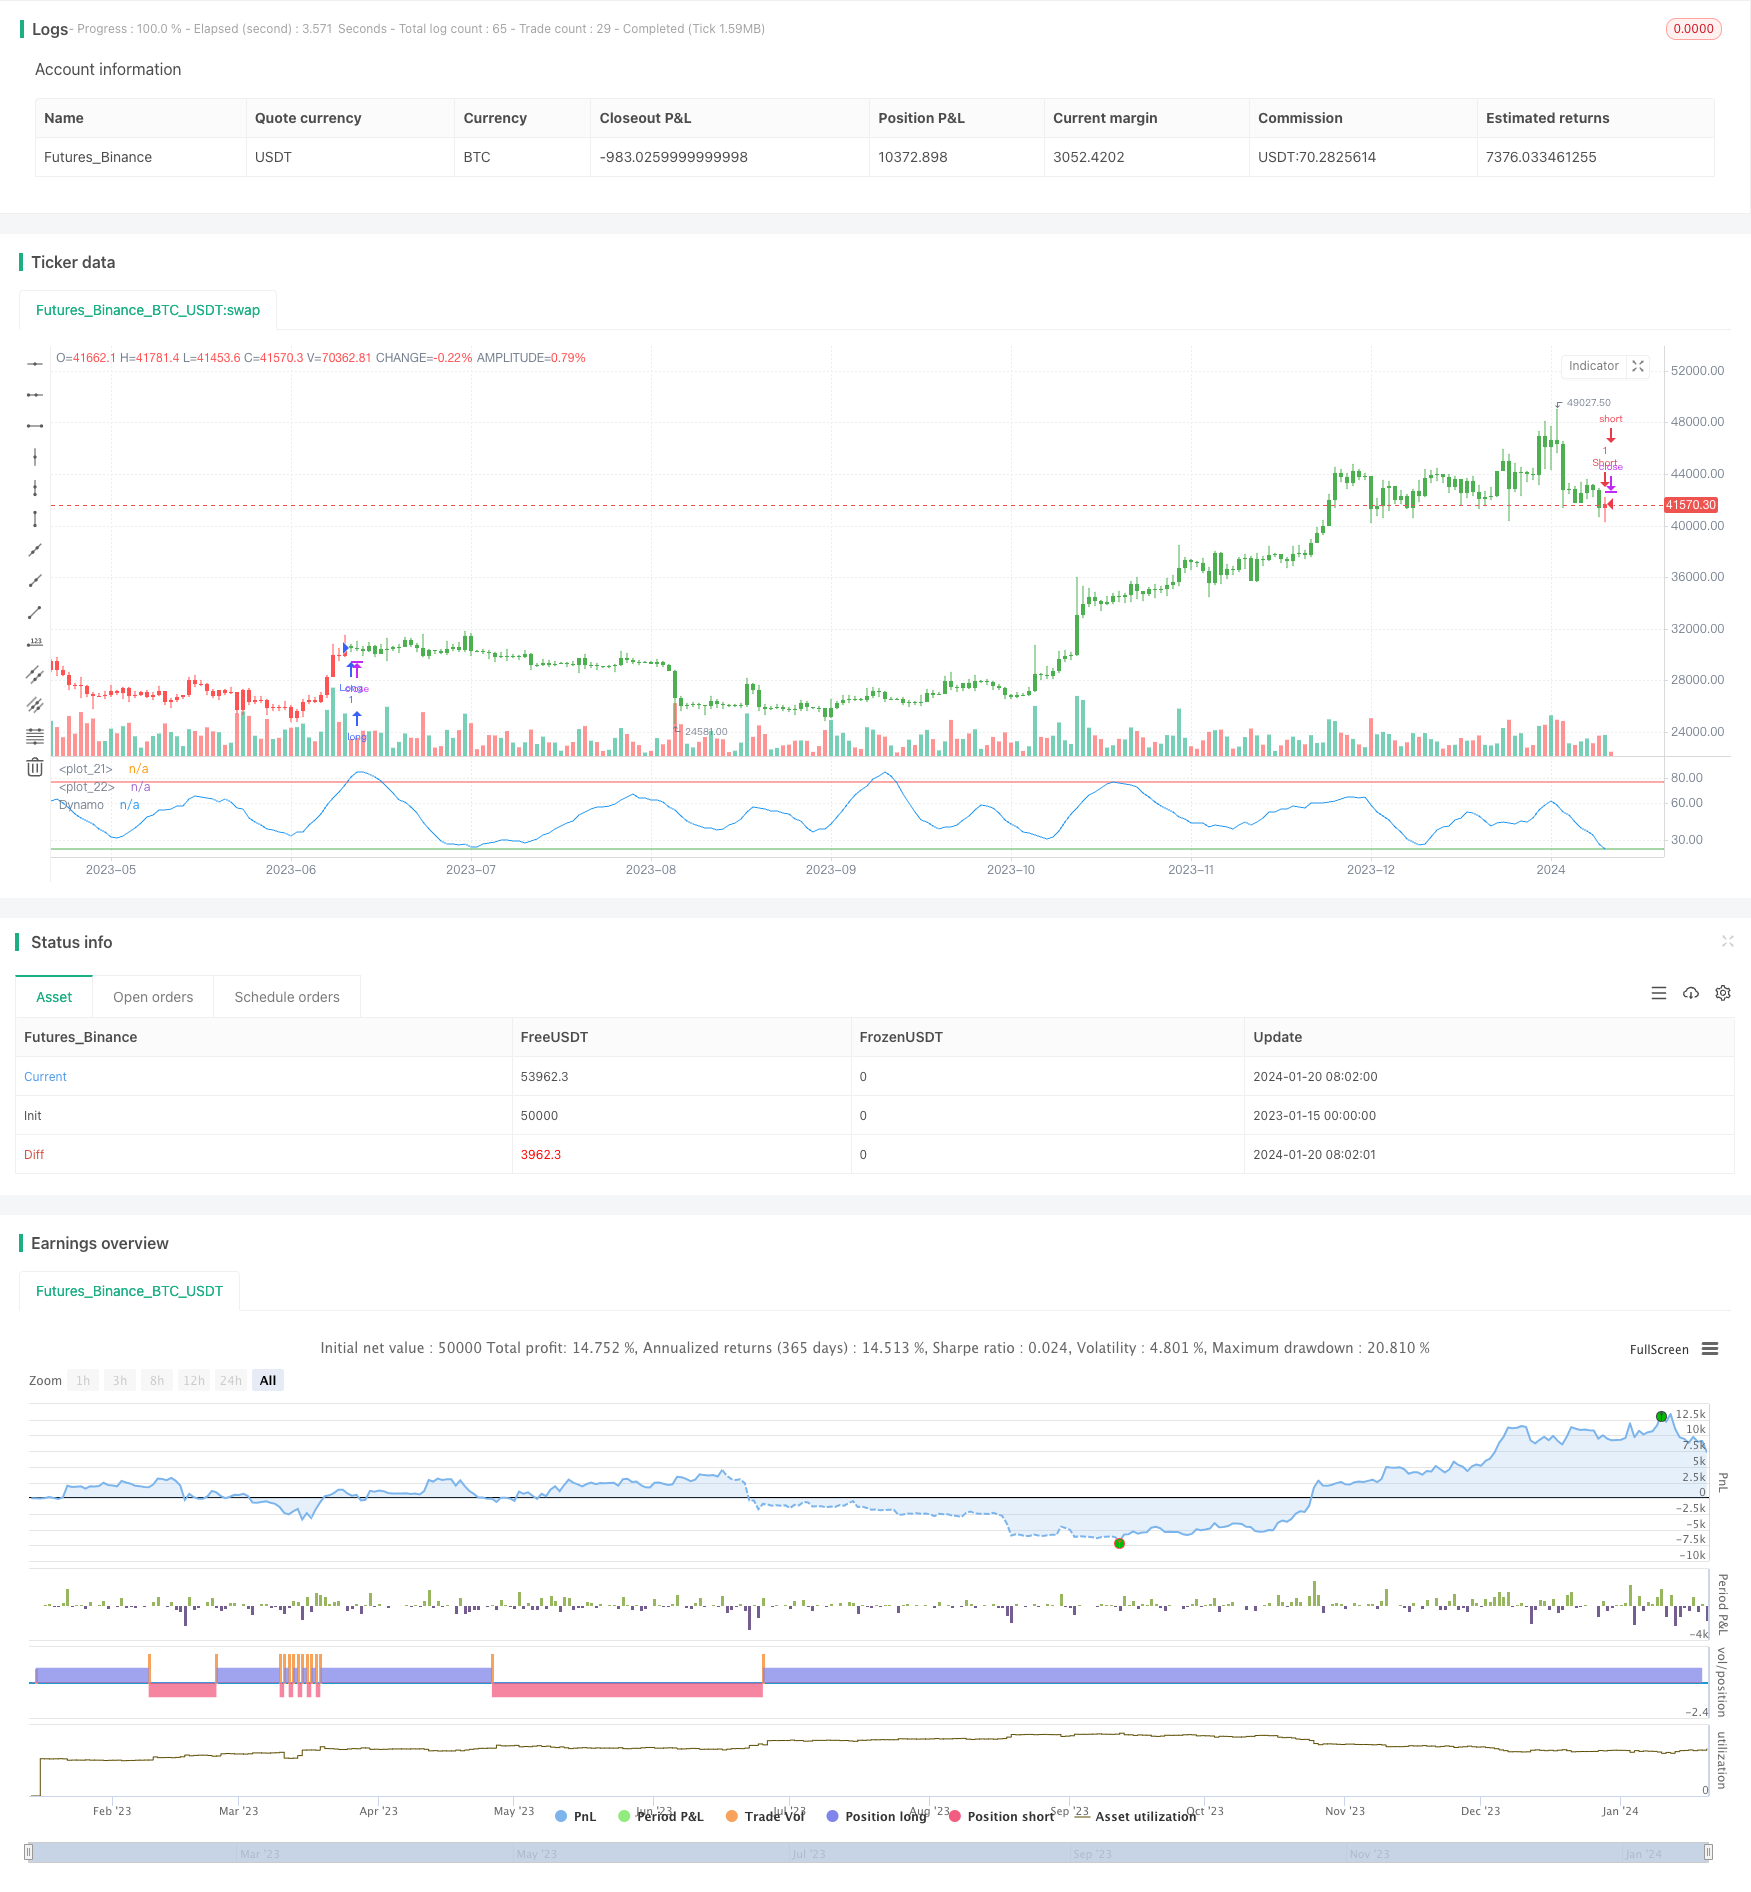
L’indicateur Dynamo, développé par E. Marshall Wall dans un article publié en juillet 1996 dans la revue Futures, a été normalisé par rapport à l’oscillateur standard afin d’éliminer les effets de la tendance.
Principe de stratégie
Cette stratégie consiste à calculer d’abord un indice aléatoire de 10 jours de longueur (un oscillateur stochastique), puis une moyenne mobile simple de 10 jours de l’indice, puis une moyenne mobile de 20 jours sur cette base. Cette moyenne mobile constitue la base de calcul de l’oscillateur dynamique.
Strategy calcule ensuite les valeurs maximales et minimales de l’indice, puis la moyenne. Il fait la différence entre la moyenne à 20 jours et l’indice original, puis soustrait cette différence de la moyenne pour former l’instrument de choc standardisé.
Analyse des avantages
Les principaux avantages de cette stratégie sont:
L’utilisation de l’indicateur dynamique d’oscillateur de dynamique élimine l’effet de la tendance et rend les signaux de négociation plus fiables.
En combinant les zones de survente et de surachat, il est possible d’obtenir un signal de transaction plus précis au moment du revirement.
Les règles sont simples, claires et faciles à appliquer.
Analyse des risques
Les principaux risques de cette stratégie sont:
Les indicateurs sont plus susceptibles d’émettre des signaux erronés en cas de turbulences sur le marché. Le stop loss peut être mis en place pour contrôler le risque.
Il est fréquent que des faux signaux soient générés dans les marchés en choc. Il est possible d’ajuster les paramètres de manière appropriée pour filtrer certains bruits.
La fréquence des transactions peut être élevée, et les coûts de transaction peuvent avoir un impact sur les bénéfices.
Direction d’optimisation
Cette stratégie peut être optimisée dans les domaines suivants:
Test des données sur différents marchés pour trouver les meilleurs contrats et les meilleures combinaisons de paramètres.
Augmentation des conditions de filtrage pour déterminer l’intensité de la tendance avant l’émission du signal et éviter d’être piégé lors d’une secousse.
Augmenter le mécanisme de stop loss. Choisir le stop loss et le retrait lorsque le prix franchit une limite négative.
Des systèmes de négociation plus complexes peuvent être développés sur la base de cette stratégie, et des décisions peuvent être prises en combinaison avec plusieurs autres indicateurs.
Résumer
La stratégie de négociation de l’oscillateur dynamique permet d’émettre des signaux de négociation plus précis dans les zones de survente en éliminant les effets de la tendance. La stratégie est simple et facile à mettre en œuvre, mais elle comporte également un certain risque. La stabilité et la rentabilité du système peuvent être encore améliorées par l’optimisation des paramètres et des règles.
/*backtest
start: 2023-01-15 00:00:00
end: 2024-01-21 00:00:00
period: 1d
basePeriod: 1h
exchanges: [{"eid":"Futures_Binance","currency":"BTC_USDT"}]
*/

//@version=2
////////////////////////////////////////////////////////////
//  Copyright by HPotter v1.0 10/04/2017
// In July 1996 Futures magazine, E. Marshall Wall introduces the
// Dynamic Momentum Oscillator (Dynamo). Please refer to this article
// for interpretation.
// The Dynamo oscillator is a normalizing function which adjusts the
// values of a standard oscillator for trendiness by taking the difference
// between the value of the oscillator and a moving average of the oscillator
// and then subtracting that value from the oscillator midpoint.
//
// You can change long to short in the Input Settings
// Please, use it only for learning or paper trading. Do not for real trading
////////////////////////////////////////////////////////////
strategy(title="Dynamo", shorttitle="Dynamo")
OscLen = input(10, minval=1)
MALen = input(20, minval=1)
HiBand = input(77, minval=1)
LowBand = input(23)
reverse = input(false, title="Trade reverse")
hline(HiBand, color=red, linestyle=line)
hline(LowBand, color=green, linestyle=line)
xOscK = stoch(close, high, low, OscLen)
xOscAvg = sma(xOscK, OscLen)
xMAVal = sma(xOscAvg, MALen)
maxNum = 9999999
LowestSoFar = iff(xOscAvg < nz(LowestSoFar[1], maxNum), xOscAvg, nz(LowestSoFar[1], maxNum))
HighestSoFar = iff(xOscAvg > nz(HighestSoFar[1]), xOscAvg, nz(HighestSoFar[1]))
MidPnt = (LowestSoFar + HighestSoFar) / 2
nRes = MidPnt - (xMAVal - xOscAvg)
pos = iff(nRes > HiBand, 1,
	     iff(nRes < LowBand, -1, nz(pos[1], 0)))
possig = iff(reverse and pos == 1, -1,
          iff(reverse and pos == -1, 1, pos))
if (possig == 1)
    strategy.entry("Long", strategy.long)
if (possig == -1)
    strategy.entry("Short", strategy.short)
barcolor(possig == -1 ? red: possig == 1 ? green : blue )
plot(nRes, color=blue, title="Dynamo")