Stratégie quantitative utilisant l'indicateur RSI et l'indicateur de moyenne mobile
Aperçu
La stratégie de rupture de la ligne de parité RSI est une stratégie quantitative qui utilise à la fois l’indicateur RSI et l’indicateur de la ligne de parité pour juger du moment de la transaction. L’idée centrale de cette stratégie est de filtrer les signaux en utilisant la direction de la ligne de parité pour rechercher des points de rupture de meilleure qualité pour construire des positions lorsque l’indicateur RSI atteint une zone de survente.
Principe de stratégie
L’indicateur RSI et la moyenne mobile simple sont calculés en fonction des paramètres définis par l’utilisateur.
Lorsque le RSI franchit la ligne de survente définie (default 30), un signal de multiplication est généré si le prix est inférieur à la ligne moyenne de sortie de LONG.
Lorsque le RSI franchit la ligne de survente définie (default 70), un signal de tête vide est généré si le prix est supérieur à la ligne moyenne de sortie SHORT.
L’utilisateur peut sélectionner la ligne moyenne de filtrage, et le signal est généré lorsque le prix est au-dessus de la ligne moyenne de filtrage.
Les sorties de position sont déterminées par les lignes de sortie LONG et SHORT.
Analyse des avantages
Les deux indicateurs ont été conçus en tenant compte de deux facteurs majeurs du marché, ce qui améliore la précision de la prise de décision.
Utilisez judicieusement les caractéristiques inverses de l’indicateur RSI pour trouver le moment de l’inversion.
Le filtrage linéaire augmente la rigueur de jugement et évite de suivre les hauts et les bas.
Les paramètres sont personnalisables et peuvent être optimisés pour différentes variétés et cycles.
Une logique simple, facile à comprendre et à modifier.
Analyse des risques
L’indicateur RSI est sujet à des courbes verticales, et l’indicateur de densité peut réduire ce problème.
Le RSI sous grand cycle est susceptible de faillite, ce qui peut réduire l’optimisation des paramètres ou aider d’autres indicateurs.
La moyenne a un retard et peut être raccourcie de manière appropriée ou complétée par des indicateurs tels que le MACD.
Les conditions de jugement simples permettent d’introduire plus d’indicateurs pour assurer l’efficacité des signaux de trading.
Direction d’optimisation
L’optimisation des paramètres RSI ou l’introduction de l’indicateur de densité réduisent la probabilité de faux signaux.
Les indicateurs de tendance et de volatilité tels que le DMI, le BOLL sont utilisés pour déterminer la tendance et le support.
L’introduction d’indicateurs comme le MACD pour remplacer ou compléter le jugement de l’équivalence.
Logique des conditions d’ouverture de position est ajoutée pour éviter les signaux de rupture défavorables.
Résumer
La stratégie de rupture de la ligne de parité RSI double utilise l’indicateur RSI pour juger de la tendance de survente et de survente et la méthode de jugement de la ligne de parité. En théorie, il est possible de saisir efficacement les opportunités de revers.
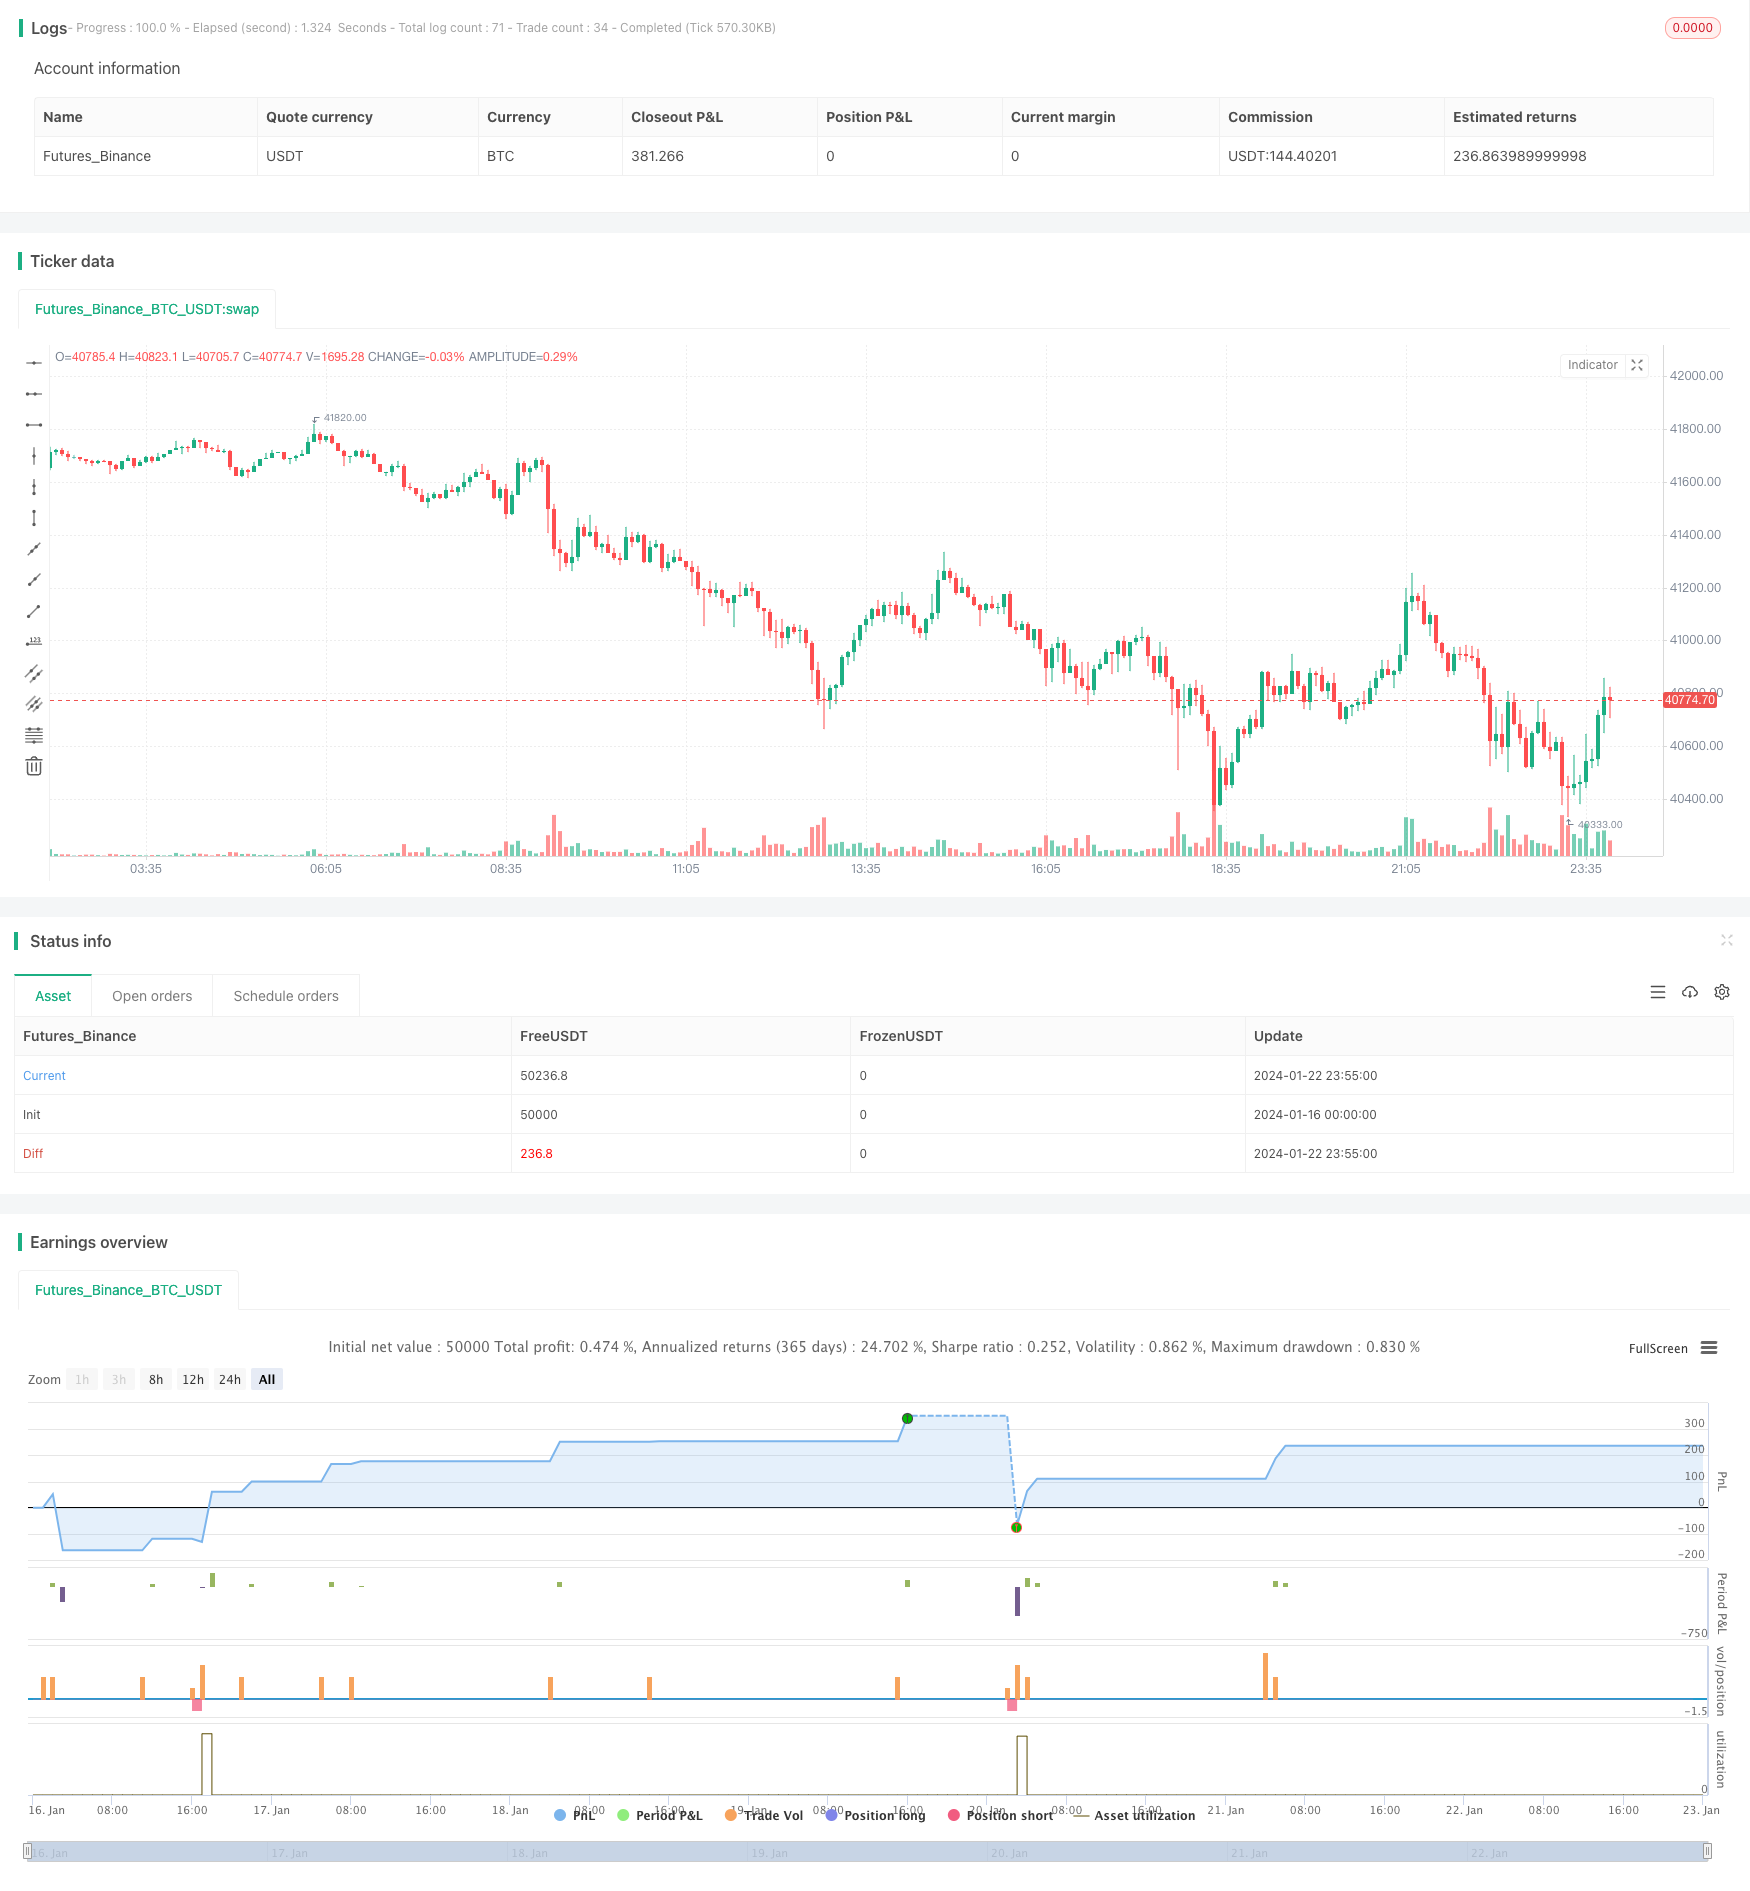
/*backtest
start: 2024-01-16 00:00:00
end: 2024-01-23 00:00:00
period: 5m
basePeriod: 1m
exchanges: [{"eid":"Futures_Binance","currency":"BTC_USDT"}]
*/

//Global Market Signals: RSI Strategy.
//@version=4
strategy("GMS: RSI Strategy", overlay=true)

LongShort = input(title="Long Only or Short Only or Both?", type=input.string, defval="Both", options=["Both", "Long Only", "Short Only"])
RSILength = input(title="RSI Length", type = input.integer ,defval=14)
RSIUpper = input(title="Upper Threshold", type = input.float ,defval=70)
RSILower = input(title="Lower Threshold", type = input.float ,defval=30)
LongExit = input(title="Long Exit SMA Length", type = input.integer ,defval=5)
ShortExit = input(title="Short Exit SMA Length", type = input.integer ,defval=5)
AboveBelow = input(title="Trend SMA Filter?", type=input.string, defval="Above", options=["Above", "Below", "Don't Include"])
TrendLength = input(title="Trend SMA Length", type = input.integer ,defval=200)


//Long Side

if LongShort =="Long Only" and AboveBelow == "Above"
    strategy.entry("LONG", true, when = rsi(close,RSILength)<RSILower and close< sma(close,LongExit) and close>sma(close,TrendLength))
    strategy.close("LONG", when = close>sma(close,LongExit))

if LongShort =="Long Only" and AboveBelow == "Below"
    strategy.entry("LONG", true, when = rsi(close,RSILength)<RSILower and close< sma(close,LongExit) and close<sma(close,TrendLength))
    strategy.close("LONG", when = close>sma(close,LongExit))

if LongShort =="Long Only" and AboveBelow == "Don't Include"
    strategy.entry("LONG", true, when = rsi(close,RSILength)<RSILower and close< sma(close,LongExit))
    strategy.close("LONG", when = close>sma(close,LongExit))

if LongShort =="Both" and AboveBelow == "Above"
    strategy.entry("LONG", true, when = rsi(close,RSILength)<RSILower and close< sma(close,LongExit) and close>sma(close,TrendLength))
    strategy.close("LONG", when = close>sma(close,LongExit))

if LongShort =="Both" and AboveBelow == "Below"
    strategy.entry("LONG", true, when = rsi(close,RSILength)<RSILower and close< sma(close,LongExit) and close<sma(close,TrendLength))
    strategy.close("LONG", when = close>sma(close,LongExit))

if LongShort =="Both" and AboveBelow == "Don't Include"
    strategy.entry("LONG", true, when = rsi(close,RSILength)<RSILower and close< sma(close,LongExit))
    strategy.close("LONG", when = close>sma(close,LongExit))


//SHORT SIDE

if LongShort =="Short Only" and AboveBelow == "Above"
    strategy.entry("SHORT", false, when = rsi(close,RSILength)>RSIUpper and close> sma(close,ShortExit) and close>sma(close,TrendLength))
    strategy.close("SHORT", when = close<sma(close,ShortExit))

if LongShort =="Short Only" and AboveBelow == "Below"
    strategy.entry("SHORT", false, when = rsi(close,RSILength)>RSIUpper and close> sma(close,ShortExit) and close<sma(close,TrendLength))
    strategy.close("SHORT", when = close<sma(close,ShortExit))

if LongShort =="Short Only" and AboveBelow == "Don't Include"
    strategy.entry("SHORT", false, when = rsi(close,RSILength)>RSIUpper and close> sma(close,ShortExit))
    strategy.close("SHORT", when = close<sma(close,ShortExit))

if LongShort =="Both" and AboveBelow == "Above"
    strategy.entry("SHORT", false, when = rsi(close,RSILength)>RSIUpper and close> sma(close,ShortExit) and close>sma(close,TrendLength))
    strategy.close("SHORT", when = close<sma(close,ShortExit))

if LongShort =="Both" and AboveBelow == "Below"
    strategy.entry("SHORT", false, when = rsi(close,RSILength)>RSIUpper and close> sma(close,ShortExit) and close<sma(close,TrendLength))
    strategy.close("SHORT", when = close<sma(close,ShortExit))

if LongShort =="Both" and AboveBelow == "Don't Include"
    strategy.entry("SHORT", false, when = rsi(close,RSILength)>RSIUpper and close> sma(close,ShortExit))
    strategy.close("SHORT", when = close<sma(close,ShortExit))