概述
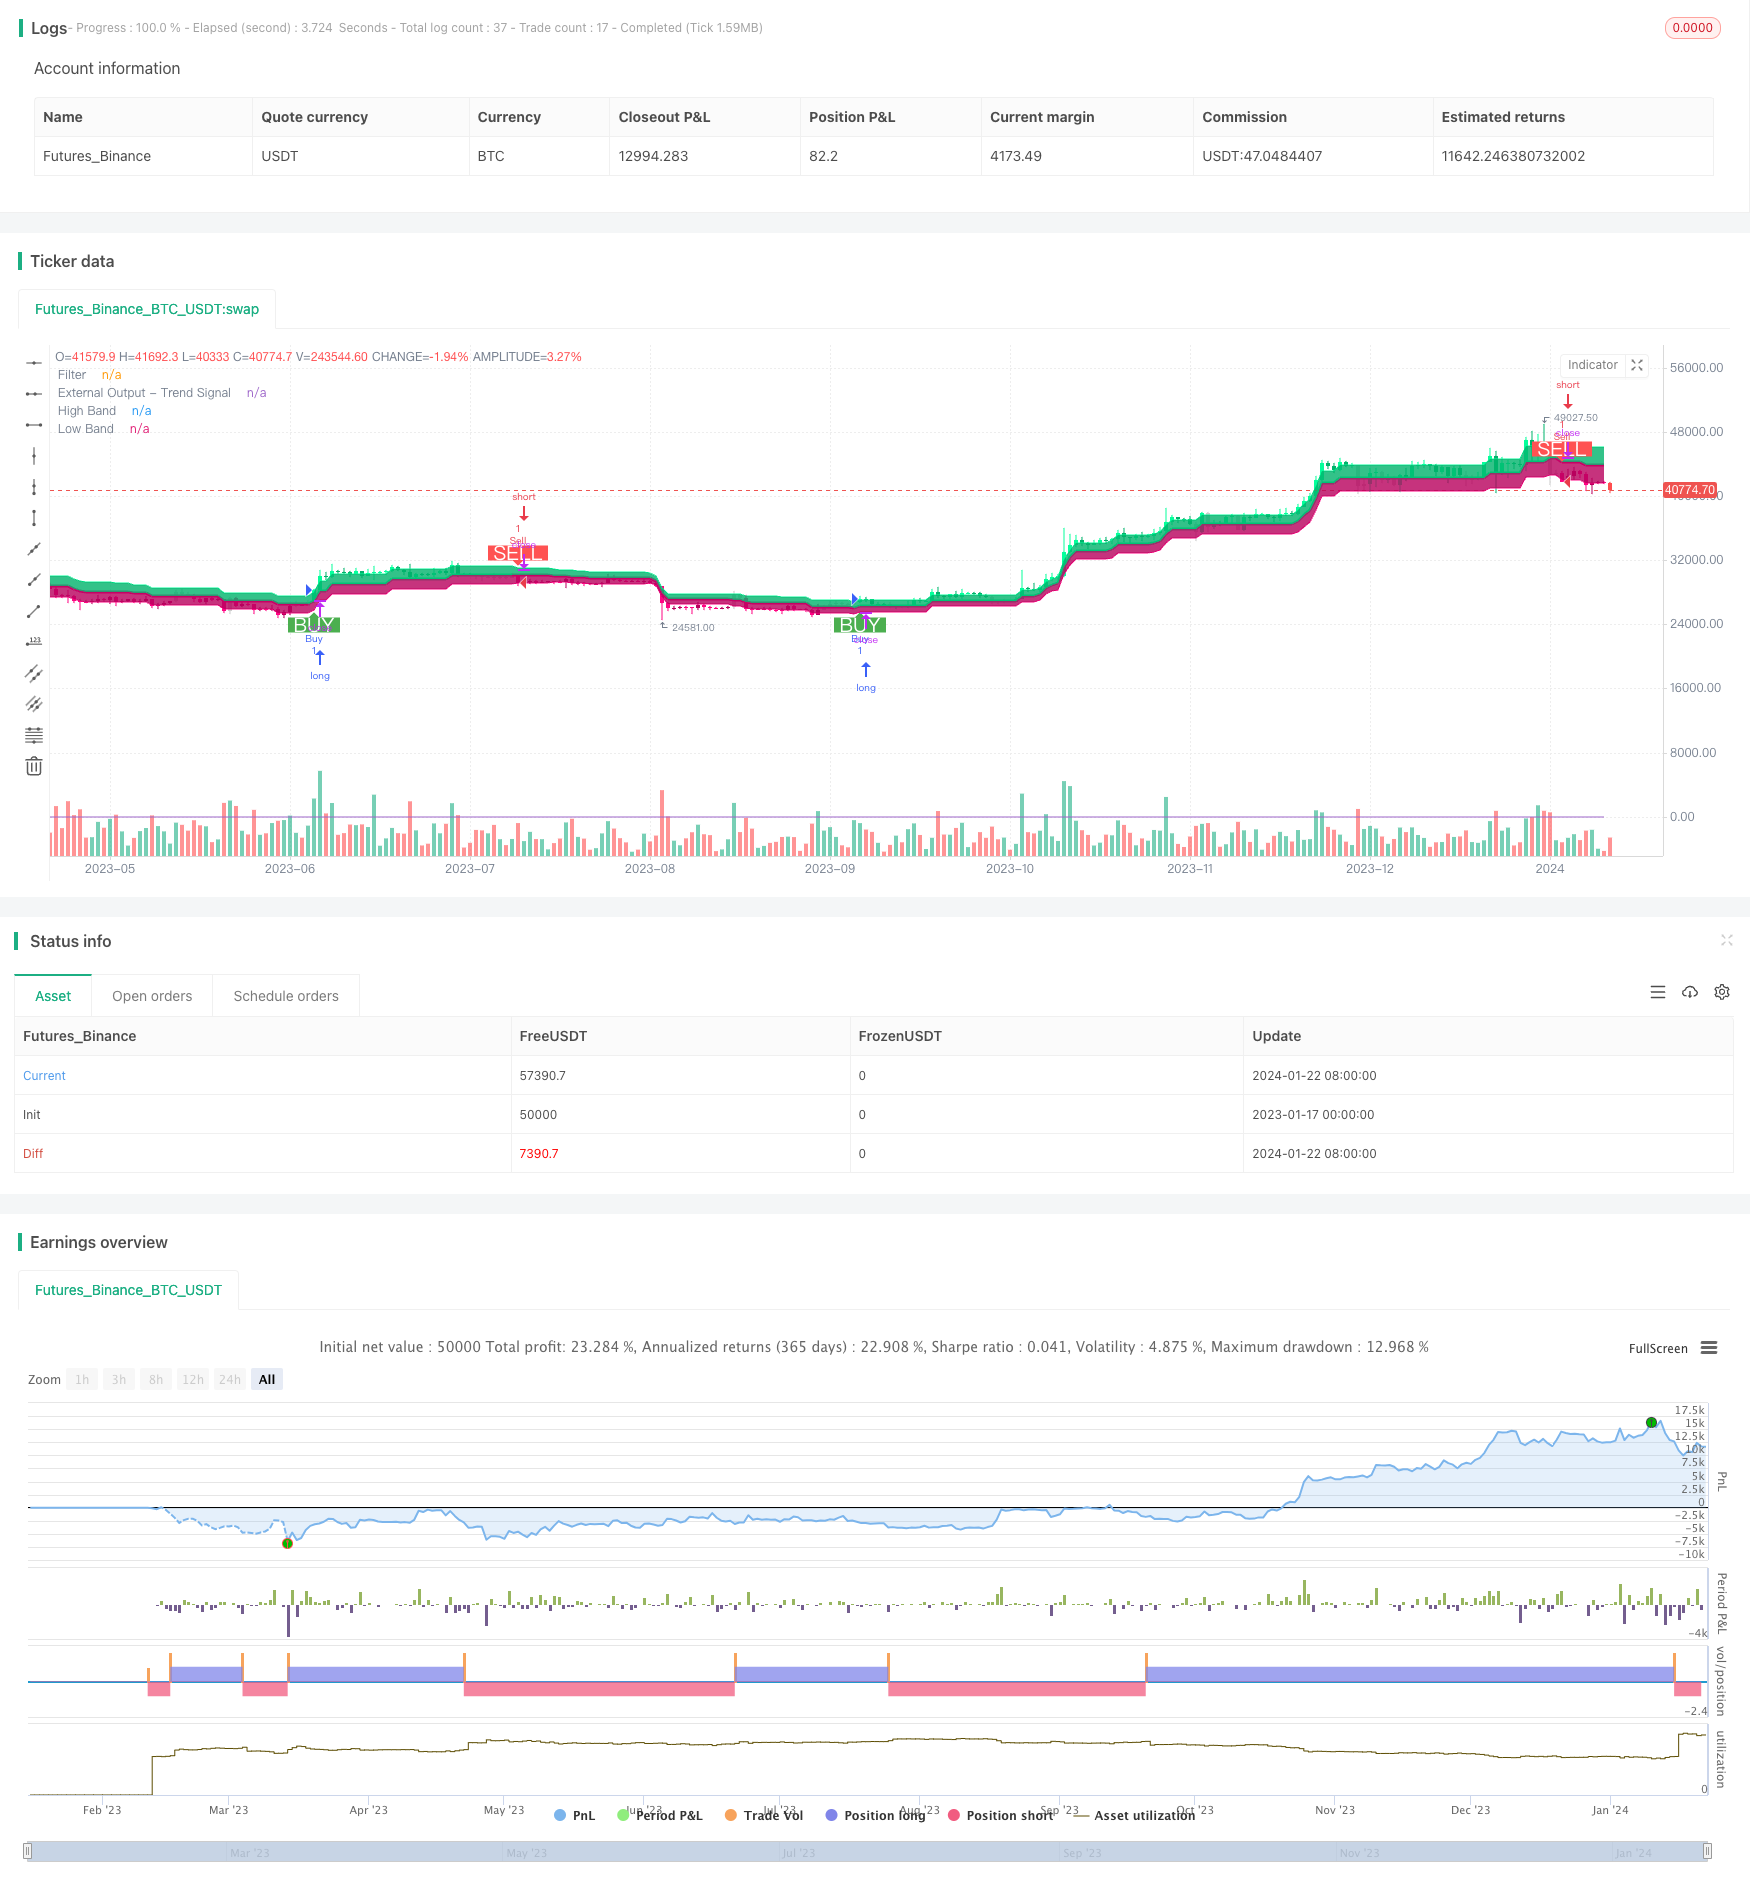
该策略是一种双向自适应的范围滤波动量跟踪策略。它利用自适应范围滤波器跟踪价格波动,并结合量能指标判断价值方向,实现低买高卖。
策略原理
- 利用自适应范围滤波器跟踪价格波动。滤波器大小根据用户设定的范围周期、数量和规模进行自适应调整。
- 滤波器分为Type 1和Type 2两种类型。Type 1为标准范围跟踪型,Type 2为阶梯约整型。
- 根据滤波器和收盘价的大小关系判断价格波动方向。价格在上轨之上为看涨,下轨之下为看跌。
- 结合收盘价较前一日的涨跌关系,判断价值方向。价值上升为多头,下降为空头。
- 当价格突破上轨且价值上升时发出买入信号;当价格跌破下轨且价值下降时发出卖出信号。
优势分析
- 自适应范围滤波器可以准确抓取市场波动。
- 两种类型的滤波器可以满足不同交易偏好。
- 结合量能指标可有效识别价值方向。
- 策略灵活,可以根据市场调整参数。
- 可 Customize 选择合适的交易条件逻辑。
风险分析
- 参数设置不当可能导致过度交易或漏单。
- 突破信号存在一定滞后。
- 量能指标存在一定卡顿风险。
- 范围突破容易被套。
风险防范:
- 选择合适的参数组合并适时调整。
- 结合其他指标识别趋势。
- 在关键位附近及趋势反转时审慎交易。
优化方向
- 测试不同的范围大小和平滑周期参数组合,找到最佳组合。
- 尝试不同的滤波器类型,选择个人偏好类型。
- 试验其他量能指标或辅助技术指标。
- 优化和调整交易条件逻辑以减少非理性交易。
- 结合市场分型理论设定自适应调仓比例。
策略源码
/*backtest
start: 2023-01-17 00:00:00
end: 2024-01-23 00:00:00
period: 1d
basePeriod: 1h
exchanges: [{"eid":"Futures_Binance","currency":"BTC_USDT"}]
*/

//@version=4
strategy("Range Filter [DW] & Labels", shorttitle="RF [DW] & Labels", overlay=true)


//Conditional Sampling EMA Function
Cond_EMA(x, cond, n)=>
    var val     = array.new_float(0)
    var ema_val = array.new_float(1)
    if cond
        array.push(val, x)
        if array.size(val) > 1
            array.remove(val, 0)
        if na(array.get(ema_val, 0))
            array.fill(ema_val, array.get(val, 0))
        array.set(ema_val, 0, (array.get(val, 0) - array.get(ema_val, 0))*(2/(n + 1)) + array.get(ema_val, 0))
    EMA = array.get(ema_val, 0)
    EMA

//Conditional Sampling SMA Function
Cond_SMA(x, cond, n)=>
    var vals = array.new_float(0)
    if cond
        array.push(vals, x)
        if array.size(vals) > n
            array.remove(vals, 0)
    SMA = array.avg(vals)
    SMA

//Standard Deviation Function
Stdev(x, n)=>
    sqrt(Cond_SMA(pow(x, 2), 1, n) - pow(Cond_SMA(x, 1, n), 2))

//Range Size Function
rng_size(x, scale, qty, n)=>
    ATR      = Cond_EMA(tr(true), 1, n)
    AC       = Cond_EMA(abs(x - x[1]), 1, n)
    SD       = Stdev(x, n)
    rng_size = scale=="Pips" ? qty*0.0001 : scale=="Points" ? qty*syminfo.pointvalue : scale=="% of Price" ? close*qty/100 : scale=="ATR" ? qty*ATR :
               scale=="Average Change" ? qty*AC : scale=="Standard Deviation" ? qty*SD : scale=="Ticks" ? qty*syminfo.mintick : qty

//Two Type Range Filter Function
rng_filt(h, l, rng_, n, type, smooth, sn, av_rf, av_n)=>
    rng_smooth = Cond_EMA(rng_, 1, sn)
    r          = smooth ? rng_smooth : rng_
    var rfilt  = array.new_float(2, (h + l)/2)
    array.set(rfilt, 1, array.get(rfilt, 0))
    if type=="Type 1"
        if h - r > array.get(rfilt, 1)
            array.set(rfilt, 0, h - r)
        if l + r < array.get(rfilt, 1)
            array.set(rfilt, 0, l + r)
    if type=="Type 2"
        if h >= array.get(rfilt, 1) + r
            array.set(rfilt, 0, array.get(rfilt, 1) + floor(abs(h - array.get(rfilt, 1))/r)*r)
        if l <= array.get(rfilt, 1) - r
            array.set(rfilt, 0, array.get(rfilt, 1) - floor(abs(l - array.get(rfilt, 1))/r)*r)
    rng_filt1 = array.get(rfilt, 0)
    hi_band1  = rng_filt1 + r
    lo_band1  = rng_filt1 - r
    rng_filt2 = Cond_EMA(rng_filt1, rng_filt1 != rng_filt1[1], av_n)
    hi_band2  = Cond_EMA(hi_band1, rng_filt1 != rng_filt1[1], av_n)
    lo_band2  = Cond_EMA(lo_band1, rng_filt1 != rng_filt1[1], av_n)
    rng_filt  = av_rf ? rng_filt2 : rng_filt1
    hi_band   = av_rf ? hi_band2 : hi_band1
    lo_band   = av_rf ? lo_band2 : lo_band1
    [hi_band, lo_band, rng_filt]

//-----------------------------------------------------------------------------------------------------------------------------------------------------------------
//Inputs
//-----------------------------------------------------------------------------------------------------------------------------------------------------------------

//Filter Type
f_type = input(defval="Type 1", options=["Type 1", "Type 2"], title="Filter Type")

//Movement Source
mov_src = input(defval="Close", options=["Wicks", "Close"], title="Movement Source")

//Range Size Inputs
rng_qty   = input(defval=2.618, minval=0.0000001, title="Range Size")
rng_scale = input(defval="Average Change", options=["Points", "Pips", "Ticks", "% of Price", "ATR", "Average Change", "Standard Deviation", "Absolute"], title="Range Scale")

//Range Period
rng_per = input(defval=14, minval=1, title="Range Period (for ATR, Average Change, and Standard Deviation)")

//Range Smoothing Inputs
smooth_range = input(defval=true, title="Smooth Range")
smooth_per   = input(defval=27, minval=1, title="Smoothing Period")

//Filter Value Averaging Inputs
av_vals    = input(defval=true, title="Average Filter Changes")
av_samples = input(defval=2, minval=1, title="Number Of Changes To Average")

//-----------------------------------------------------------------------------------------------------------------------------------------------------------------
//Definitions
//-----------------------------------------------------------------------------------------------------------------------------------------------------------------

//High And Low Values
h_val = mov_src=="Wicks" ? high : close
l_val = mov_src=="Wicks" ? low : close

//Range Filter Values
[h_band, l_band, filt] = rng_filt(h_val, l_val, rng_size((h_val + l_val)/2, rng_scale, rng_qty, rng_per), rng_per, f_type, smooth_range, smooth_per, av_vals, av_samples)

//Direction Conditions
var fdir = 0.0
fdir    := filt > filt[1] ? 1 : filt < filt[1] ? -1 : fdir
upward   = fdir==1 ? 1 : 0
downward = fdir==-1 ? 1 : 0

//Colors
filt_color = upward ? #05ff9b : downward ? #ff0583 : #cccccc
bar_color  = upward and (close > filt) ? (close > close[1] ? #05ff9b : #00b36b) :
             downward and (close < filt) ? (close < close[1] ? #ff0583 : #b8005d) : #cccccc

//-----------------------------------------------------------------------------------------------------------------------------------------------------------------
//Outputs
//-----------------------------------------------------------------------------------------------------------------------------------------------------------------

//Filter Plot
filt_plot = plot(filt, color=filt_color, transp=0, linewidth=3,  title="Filter")

//Band Plots
h_band_plot = plot(h_band, color=#05ff9b, transp=100, title="High Band")
l_band_plot = plot(l_band, color=#ff0583, transp=100, title="Low Band")

//Band Fills
fill(h_band_plot, filt_plot, color=#00b36b, transp=85, title="High Band Fill")
fill(l_band_plot, filt_plot, color=#b8005d, transp=85, title="Low Band Fill")

//Bar Color
barcolor(bar_color)

//External Trend Output
plot(fdir, transp=100, editable=false, display=display.none, title="External Output - Trend Signal")

// Trading Conditions Logic
longCond = close > filt and close > close[1] and upward > 0 or close > filt and close < close[1] and upward > 0
shortCond = close < filt and close < close[1] and downward > 0 or close < filt and close > close[1] and downward > 0

CondIni = 0
CondIni := longCond ? 1 : shortCond ? -1 : CondIni[1]
longCondition = longCond and CondIni[1] == -1
shortCondition = shortCond and CondIni[1] == 1

// Strategy Entry and Exit
strategy.entry("Buy", strategy.long, when = longCondition)
strategy.entry("Sell", strategy.short, when = shortCondition)

strategy.close("Buy", when = shortCondition)
strategy.close("Sell", when = longCondition)

// Plot Buy and Sell Labels
plotshape(longCondition, title = "Buy Signal", text ="BUY", textcolor = color.white, style=shape.labelup, size = size.normal, location=location.belowbar, color = color.green, transp = 0)
plotshape(shortCondition, title = "Sell Signal", text ="SELL", textcolor = color.white, style=shape.labeldown, size = size.normal, location=location.abovebar, color = color.red, transp = 0)

// Alerts
alertcondition(longCondition, title="Buy Alert", message = "BUY")
alertcondition(shortCondition, title="Sell Alert", message = "SELL")