Stratégie de suivi de tendance sur plusieurs périodes
Aperçu
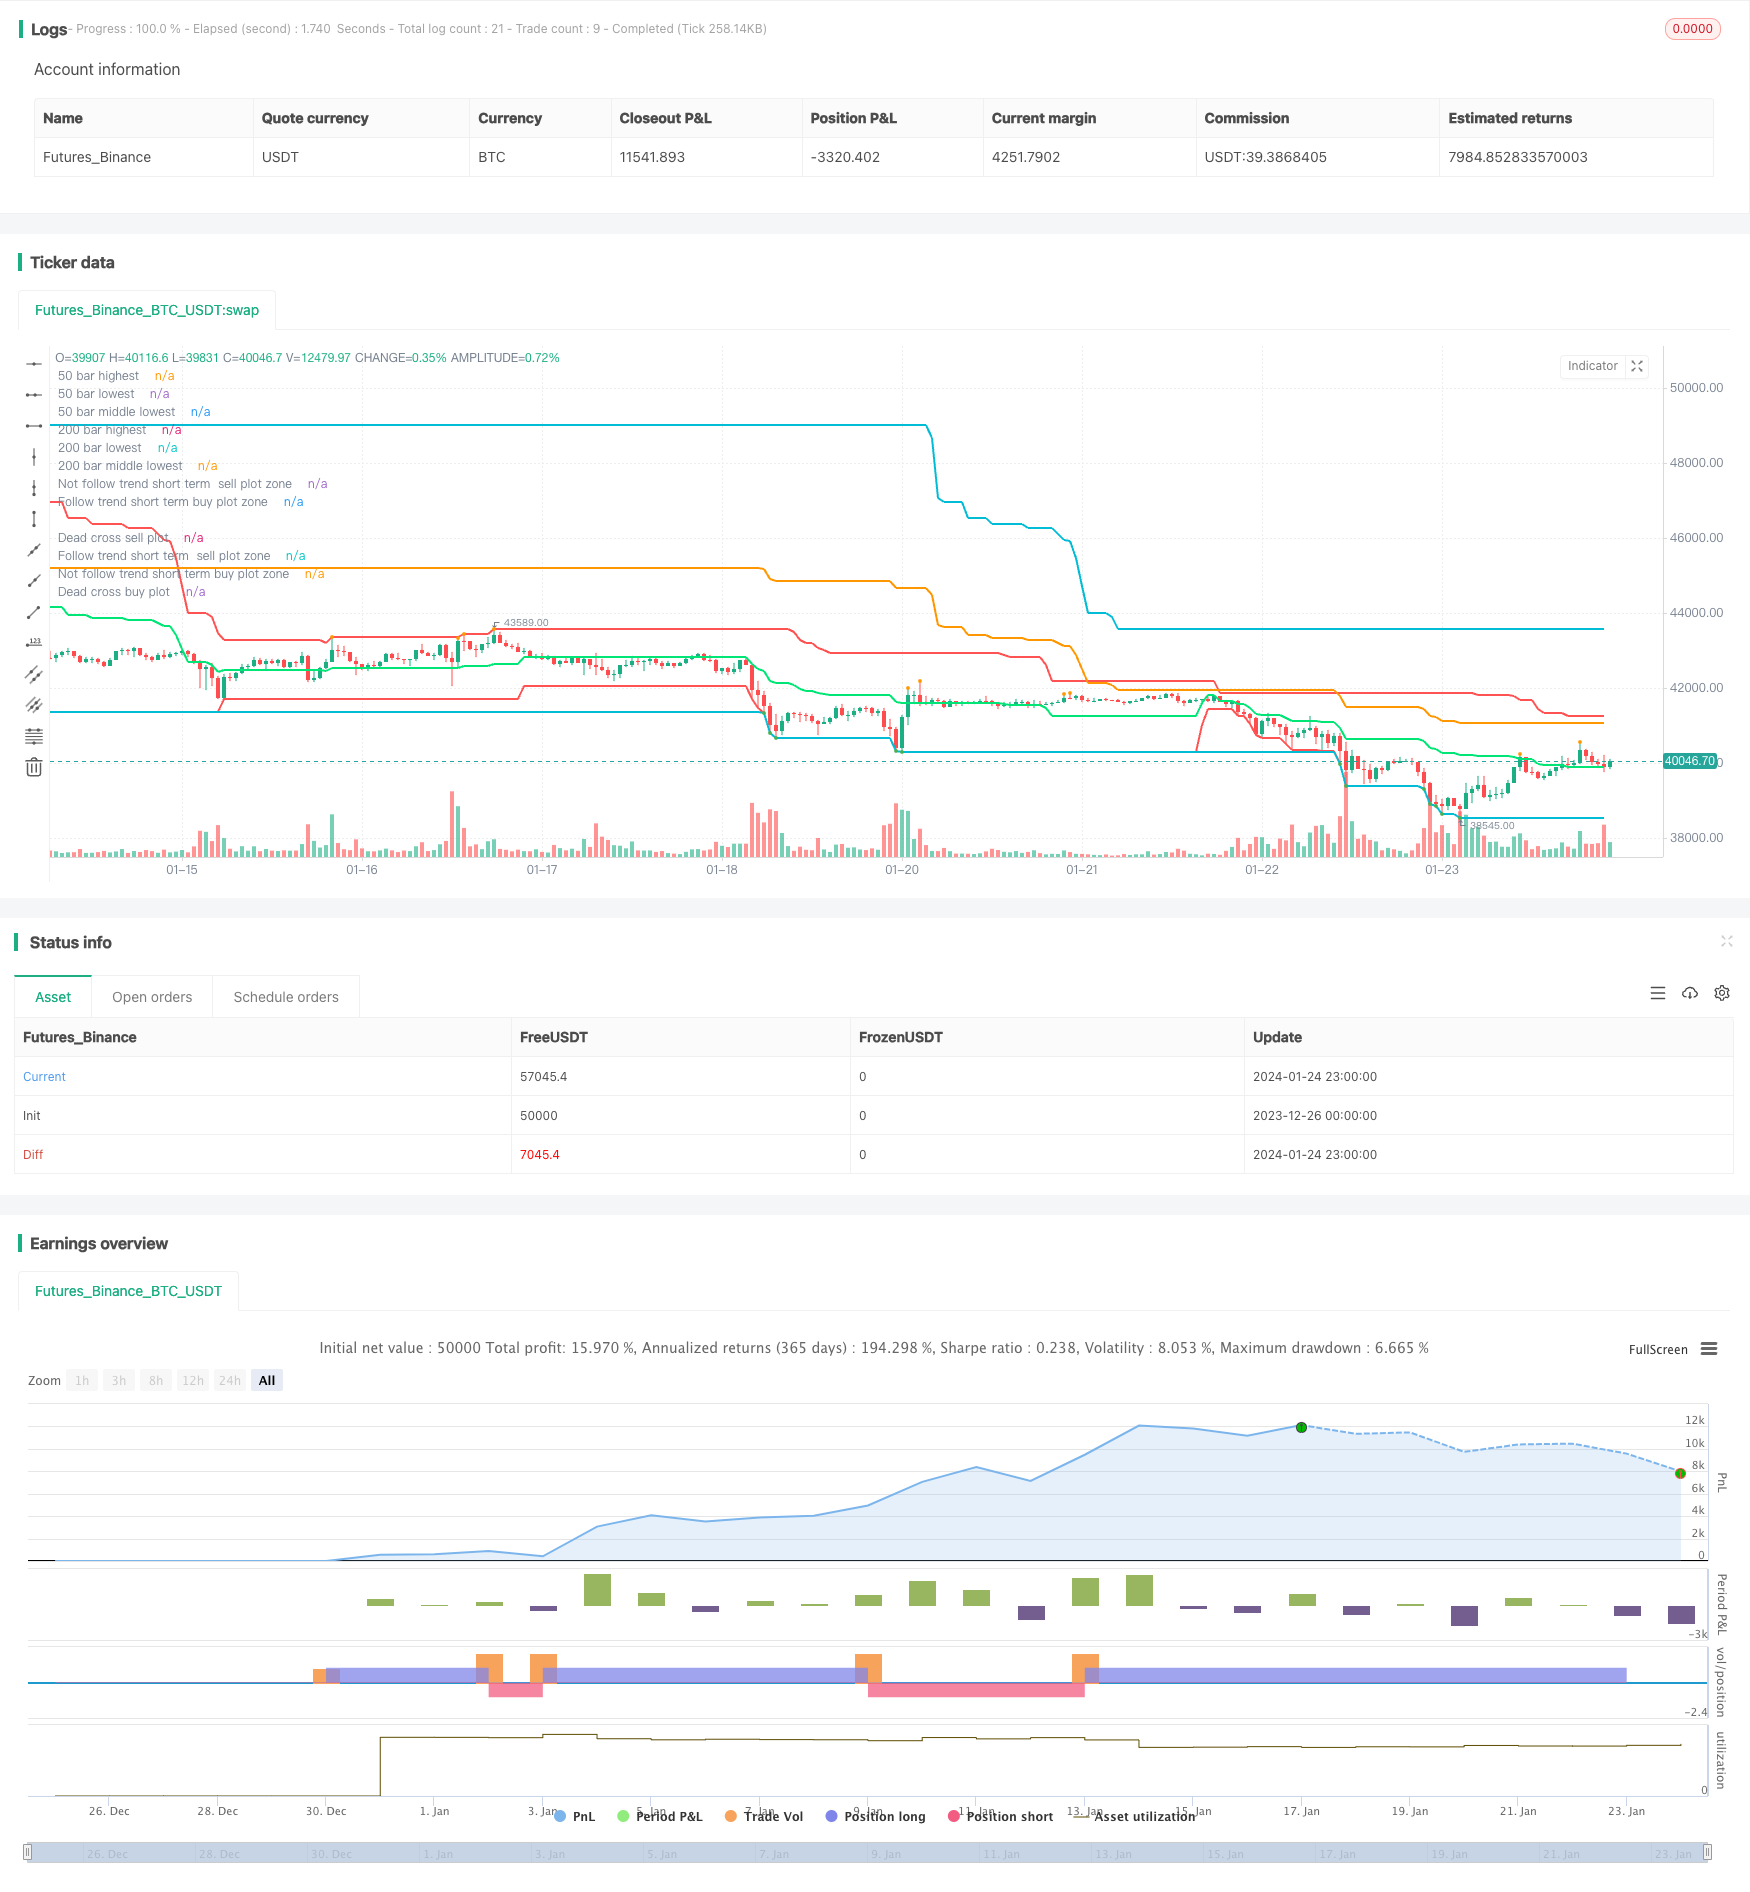
La stratégie forme un canal de prix principal qui représente la direction de la tendance à long terme en calculant les prix les plus élevés et les plus bas dans différentes périodes de temps (à 50 et 200 bars). La stratégie détermine la direction de la tendance à court terme en combinant des lignes de signal rapides et des lignes de signal lentes.
Principe de stratégie
Tout d’abord, en calculant les hauts et les bas des 50 derniers bars, ainsi que les hauts et les bas des 200 derniers bars, deux canaux de prix sont formés pour représenter la direction de la tendance à long terme.
Deuxièmement, calculer les prix les plus élevés et les plus bas des 7 dernières barres pour déterminer la tendance à court terme des canaux de signaux rapides; calculer les prix les plus élevés et les plus bas des 20 dernières barres pour déterminer la tendance à court terme des canaux de signaux lents.
Enfin, un signal d’entrée est donné lorsque les canaux de signaux rapides, les canaux de signaux lents et les canaux de prix à long terme sont alignés. Par exemple, tous les canaux sont en tendance haussière, ce qui incite à acheter; tous les canaux sont en tendance baissière, ce qui incite à vendre.
Analyse des avantages
Le plus grand avantage de cette stratégie réside dans la capacité à identifier la direction d’une tendance à long terme unifiée. En confirmant les canaux de prix de différentes périodes de temps, il est possible d’éviter efficacement d’être confondu par le bruit du marché à court terme.
En outre, la stratégie utilise des jugements sur plusieurs périodes de temps, ce qui garantit la stabilité du signal, même si une inversion de prix à court terme ne modifie pas facilement le signal.
Analyse des risques
Le principal risque de cette stratégie réside dans le fait qu’il y a un certain retard dans la génération du signal en cas de revers de tendance à court et long terme, car plusieurs canaux de confirmation de cycle de temps sont nécessaires. Le suivi aveugle peut entraîner une expansion des pertes.
En outre, il est hostile aux transactions à haute fréquence et ne peut pas réagir rapidement aux fluctuations de prix à court terme.
Direction d’optimisation
On peut envisager d’inclure une stratégie d’arrêt dynamique adaptative, qui permet de contrôler efficacement le risque en arrêtant la sortie lorsque le prix franchit un certain pourcentage dans une direction défavorable.
En outre, il est possible d’ajouter des canaux de prix de différentes longueurs, permettant de déterminer le signal final par le biais d’un vote, ce qui améliore la précision du jugement.
Ou bien, les paramètres de chaque canal peuvent être optimisés automatiquement par des algorithmes d’apprentissage automatique pour les rendre plus adaptés à l’environnement actuel du marché.
Résumer
L’idée générale de la stratégie est claire et compréhensible, elle permet d’évaluer les tendances du marché grâce à des canaux de prix à plusieurs périodes et d’éliminer efficacement le bruit du marché à court terme. Cependant, il faut renforcer le traitement des situations de retournement et le contrôle des risques.
/*backtest
start: 2023-12-26 00:00:00
end: 2024-01-25 00:00:00
period: 1h
basePeriod: 15m
exchanges: [{"eid":"Futures_Binance","currency":"BTC_USDT"}]
*/

// This source code is subject to the terms of the Mozilla Public License 2.0 at https://mozilla.org/MPL/2.0/
// © ZoomerXeus

//@version=4
strategy("Swing High Low Price Channel V.1", overlay=true)

//========================= variable =================================//
dead_channel_source = input(title="Main swing channel source", defval="H/L", options=["H/L"])
fast_signal_length = input(title="Fast Slow Length", type=input.integer, defval=7, maxval=49, minval=1)
slow_signal_length = input(title="Slow Slow Length", type=input.integer, defval=20, maxval=49, minval=1)
is_show_only_dead_channel = input(title="Show main channel only", defval=true)
main_channel_width = input(title="Main line width", defval=2, minval=1)
signal_channel_width = input(title="Signal line width", defval=1, minval=1)

//========================= indicator function =================================//
dead_cross_high_50 = highest(high, 50)
dead_cross_high_200 = highest(high, 200)
//========================================
dead_cross_low_50 = lowest(low, 50)
dead_cross_low_200 = lowest(low, 200)
//========================================
medain_dead_cross_50 = ((dead_cross_high_50-dead_cross_low_50)*0.5)+dead_cross_low_50
medain_dead_cross_200 = ((dead_cross_high_200-dead_cross_low_200)*0.5)+dead_cross_low_200


//========================================
fasthighest = highest(high, fast_signal_length)
fastlowest = lowest(low, fast_signal_length)
//========================================
slowhighest = highest(high, slow_signal_length)
slowlowest = lowest(low, slow_signal_length)
//========================================


//========================= plot =================================//
plot(dead_channel_source == "H/L" ? dead_cross_high_50 : na,title="50 bar highest", color=color.red, linewidth=main_channel_width)
plot(dead_channel_source == "H/L" ? dead_cross_high_200 : na,title="200 bar highest", color=color.aqua, linewidth=main_channel_width)
plot(dead_channel_source == "H/L" ? dead_cross_low_50 : na,title="50 bar lowest", color=color.red, linewidth=main_channel_width)
plot(dead_channel_source == "H/L" ? dead_cross_low_200 : na,title="200 bar lowest", color=color.aqua, linewidth=main_channel_width)
plot(dead_channel_source == "H/L" ? medain_dead_cross_200 : na,title="200 bar middle lowest", color=color.orange, linewidth=main_channel_width)
plot(dead_channel_source == "H/L" ? medain_dead_cross_50 : na,title="50 bar middle lowest", color=color.lime, linewidth=main_channel_width)
//===========================================
plot(is_show_only_dead_channel == false ? fasthighest : na,title="fast signal highest", color=#ff00f9, linewidth=signal_channel_width)
plot(is_show_only_dead_channel == false ? fastlowest : na,title="fast signal lowest", color=#ff00f9, linewidth=signal_channel_width)
plot(is_show_only_dead_channel == false ? slowhighest : na,title="slow signal highest", color=color.white, linewidth=signal_channel_width)
plot(is_show_only_dead_channel == false ? slowlowest : na,title="slow signal lowest", color=color.white, linewidth=signal_channel_width)
//===========================================
plot(crossover(medain_dead_cross_50, medain_dead_cross_200) ? medain_dead_cross_200 : na, title="Dead cross buy plot", style=plot.style_circles, linewidth=6, color=color.lime)
plot(crossunder(medain_dead_cross_50, medain_dead_cross_200) ? medain_dead_cross_200 : na, title="Dead cross sell plot", style=plot.style_circles, linewidth=6, color=color.red)
plot(is_show_only_dead_channel and (medain_dead_cross_50 < medain_dead_cross_200) and high == slowhighest ? high : na, title="Follow trend short term  sell plot zone", style=plot.style_circles, linewidth=3, color=color.orange)
plot(is_show_only_dead_channel and (medain_dead_cross_50 > medain_dead_cross_200) and low == slowlowest ? low : na, title="Follow trend short term buy plot zone", style=plot.style_circles, linewidth=3, color=color.green)
plot(is_show_only_dead_channel and high == slowhighest and (high == dead_cross_high_200) ? high : na, title="Not follow trend short term  sell plot zone", style=plot.style_circles, linewidth=3, color=color.orange)
plot(is_show_only_dead_channel and low == slowlowest and (low == dead_cross_low_200) ? low : na, title="Not follow trend short term buy plot zone", style=plot.style_circles, linewidth=3, color=color.green)

//===================== open close order condition =========================================================//
strategy.entry("strong buy", true, 1, when=low == dead_cross_low_200)
strategy.exit("close strong buy 50%", "strong buy", qty_percent=50, when=high==slowhighest)
strategy.entry("strong sell", false, 1, when=high == dead_cross_high_200)
strategy.exit("close strong sell 50%", "strong sell", qty_percent=50, when=low==slowlowest)