Stratégie de rupture choc à double sens
Aperçu
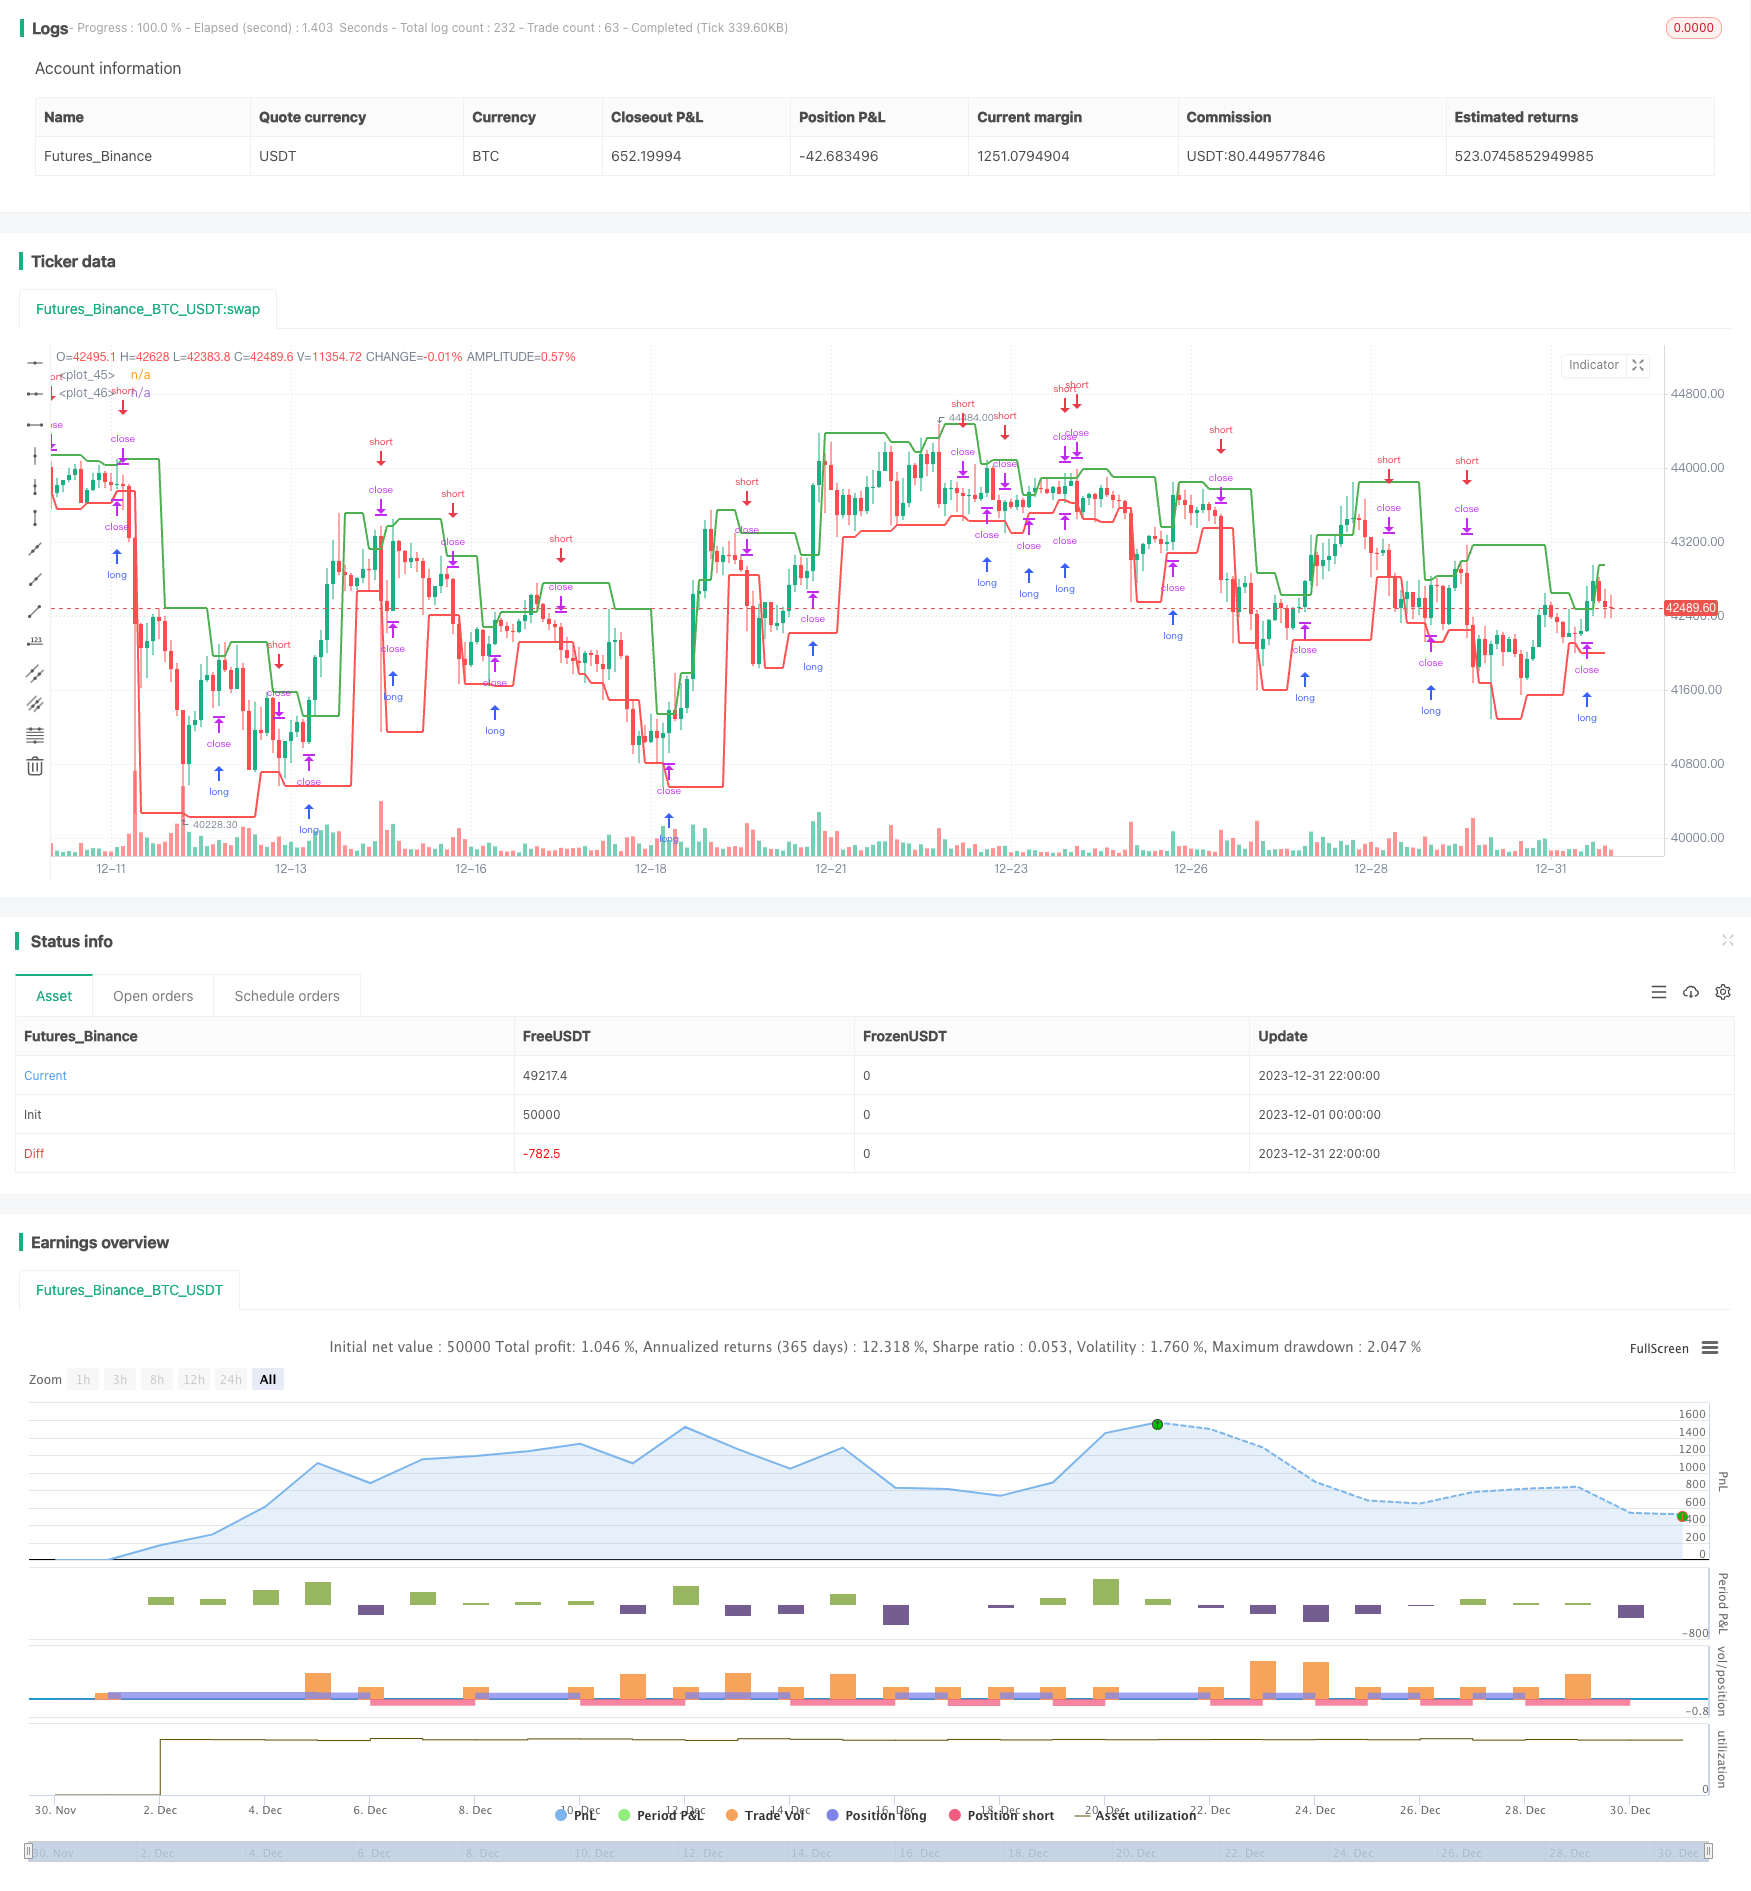
Cette stratégie est une stratégie de trading quantitative basée sur une rupture bidirectionnelle des oscillations de prix. Elle utilise le point de basse haute pivot comme point de résistance de soutien clé du prix, et fait plus lorsque le prix franchit le point de haute pivot, et fait moins quand il franchit le point bas pivot, pour réaliser une opération bidirectionnelle.
Principe de stratégie
La logique centrale de la stratégie est basée sur des points de rupture de prix bidirectionnels. Plus précisément, il y a les étapes suivantes:
Calculer les hauts et les bas pivots d’une période donnée. Les fonctions ta.pivothigh () et ta.pivotlow () sont utilisées pour calculer le plus haut prix des 2 derniers jours comme haut et le plus bas prix des 1 derniers jours comme bas.
Lorsque le prix atteint le sommet critique calculé ci-dessus, faire une entrée plus élevée. Lorsque le prix atteint le sommet critique, faire une entrée à court terme.
Utilisez un seul stop loss. Lorsque vous faites plus, le stop loss est le point le plus élevé + le plus petit changement de prix; lorsque vous faites court, le stop loss est le point le plus bas - le plus petit changement de prix.
Les hauts et les bas des points clés sont tracés pour faciliter le jugement intuitif.
De cette façon, lorsque les prix sont volatiles, il est possible d’entrer en jeu à l’heure de la rupture des points critiques et de s’arrêter rapidement, ce qui permet de réaliser des bénéfices. Lorsque les prix atteignent continuellement de nouveaux sommets ou de nouvelles basses, la stratégie permet de réaliser plusieurs gains cumulatifs.
Analyse des avantages
Les principaux avantages de cette stratégie de percée bilatérale sont les suivants:
La stratégie est simple: il suffit de franchir les hauts et les bas de Pivot pour entrer dans le jeu.
Il est facile de mettre en place des arrêts de perte. Faire plus de prises de position en utilisant le point de perte le plus élevé, le point le plus bas et la distance de variation la plus faible, ce qui permet un arrêt rapide et un contrôle efficace du risque.
La stratégie peut être appliquée de manière aléatoire et cumulative, quel que soit le cours de la bourse.
La stratégie est adaptée aux situations de choc. Lorsque les prix sont en hausse ou en baisse fréquente, la stratégie peut entrer dans la zone et obtenir des bénéfices fréquents.
Analyse des risques
Malgré ces avantages, la stratégie comporte des risques à prendre en compte:
La mauvaise définition des points clés peut augmenter les pertes. Si les points hauts et bas sont mal réglés, il peut arriver que, dans des cas extrêmes, les pertes se poursuivent.
La stratégie peut commencer à perdre de l’argent après la fin d’une secousse. Il est difficile de gagner de l’argent lorsque les prix commencent à se briser unilatéralement au lieu d’une secousse.
Une fausse rupture peut être une fausse rupture à court terme. Une fausse rupture peut également se produire à court terme, ce qui entraîne des transactions erronées dans la stratégie.
Dans l’ensemble, la stratégie est mieux adaptée à une situation de choc. Les investisseurs doivent faire attention à leur jugement et éviter d’utiliser la stratégie dans une situation de tendance.
Direction d’optimisation
Compte tenu des risques mentionnés ci-dessus, il y a lieu d’optimiser la stratégie principalement dans les domaines suivants:
La sélection intelligente des paramètres des points critiques les plus élevés et les plus bas. Le système peut être optimisé automatiquement par des moyens tels que l’apprentissage automatique pour sélectionner les paramètres des points critiques les plus appropriés.
L’augmentation de la logique de jugement de la tendance sur la base de la stratégie, l’utilisation de la stratégie en cas de choc et l’arrêt de la stratégie en cas de tendance unilatérale, réduisant ainsi les pertes.
Augmentation des stratégies de stop-loss. Des stratégies de stop-loss plus sophistiquées peuvent être conçues, telles que des stop-loss mobiles, des stop-loss intermédiaires, etc., pour contrôler davantage le risque.
Résumer
Cette stratégie est une stratégie de rupture bidirectionnelle simple et pratique. Elle s’appuie sur la rupture des points critiques des prix pour entrer en jeu et met en place un risque de garantie de stop-loss contrôlable.
/*backtest
start: 2023-12-01 00:00:00
end: 2023-12-31 23:59:59
period: 2h
basePeriod: 15m
exchanges: [{"eid":"Futures_Binance","currency":"BTC_USDT"}]
*/

//@version=5
strategy('Monthly Returns with Benchmark', overlay=true, default_qty_type=strategy.percent_of_equity, default_qty_value=25, commission_type=strategy.commission.percent, commission_value=0.1)

////////////
// Inputs //

// Pivot points inputs
leftBars   = input(2, group = "Pivot Points")
rightBars  = input(1, group = "Pivot Points")

// Styling inputs
prec       = input(2, title='Return Precision',                            group = "Monthly Table")
from_date  = input(timestamp("01 Jan 2000 00:00 +0000"), "From Date", group = "Monthly Table")
prof_color = input.color(color.green, title = "Gradient Colors", group = "Monthly Table", inline = "colors")
loss_color = input.color(color.red,   title = "",                group = "Monthly Table", inline = "colors")

// Benchmark inputs
use_cur    = input.bool(true,        title = "Use current Symbol for Benchmark", group = "Benchmark")
symb_bench = input('BTC_USDT:swap', title = "Benchmark",                        group = "Benchmark")
disp_bench = input.bool(true,        title = "Display Benchmark?",               group = "Benchmark")
disp_alpha = input.bool(true,        title = "Display Alpha?",                   group = "Benchmark")

// Pivot Points Strategy
swh = ta.pivothigh(leftBars, rightBars)
swl = ta.pivotlow(leftBars, rightBars)

hprice = 0.0
hprice := not na(swh) ? swh : hprice[1]

lprice = 0.0
lprice := not na(swl) ? swl : lprice[1]

le = false
le := not na(swh) ? true : le[1] and high > hprice ? false : le[1]

se = false
se := not na(swl) ? true : se[1] and low < lprice ? false : se[1]

if le
    strategy.entry('PivRevLE', strategy.long, comment='PivRevLE', stop=hprice + syminfo.mintick)

if se
    strategy.entry('PivRevSE', strategy.short, comment='PivRevSE', stop=lprice - syminfo.mintick)

plot(hprice, color=color.new(color.green, 0), linewidth=2)
plot(lprice, color=color.new(color.red, 0), linewidth=2)

///////////////////
// MONTHLY TABLE //

new_month = month(time) != month(time[1])
new_year  = year(time)  != year(time[1])

eq       = strategy.equity
bench_eq = close

// benchmark eq
bench_eq_htf = request.security(symb_bench, timeframe.period, close)

if (not use_cur)
    bench_eq := bench_eq_htf

bar_pnl   = eq / eq[1] - 1
bench_pnl = bench_eq / bench_eq[1] - 1

cur_month_pnl = 0.0
cur_year_pnl  = 0.0

// Current Monthly P&L
cur_month_pnl := bar_index == 0 ? 0 :
                 time >= from_date and (time[1] < from_date or new_month) ? bar_pnl :
                 (1 + cur_month_pnl[1]) * (1 + bar_pnl) - 1

// Current Yearly P&L
cur_year_pnl  := bar_index == 0 ? 0 :
                 time >= from_date and (time[1] < from_date or new_year) ? bar_pnl :
                 (1 + cur_year_pnl[1]) * (1 + bar_pnl) - 1

bench_cur_month_pnl = 0.0
bench_cur_year_pnl  = 0.0

// Current Monthly P&L - Bench
bench_cur_month_pnl := bar_index == 0 or (time[1] < from_date and time >= from_date) ? 0 :
                       time >= from_date and new_month ? bench_pnl :
                       (1 + bench_cur_month_pnl[1]) * (1 + bench_pnl) - 1

// Current Yearly P&L - Bench
bench_cur_year_pnl :=  bar_index == 0 ? 0 :
                       time >= from_date and (time[1] < from_date  or new_year) ? bench_pnl :
                       (1 + bench_cur_year_pnl[1]) * (1 + bench_pnl) - 1

var month_time = array.new_int(0)
var year_time  = array.new_int(0)

var month_pnl = array.new_float(0)
var year_pnl  = array.new_float(0)

var bench_month_pnl = array.new_float(0)
var bench_year_pnl  = array.new_float(0)

// Filling monthly / yearly pnl arrays
if array.size(month_time) > 0
    if month(time) == month(array.get(month_time, array.size(month_time) - 1))
        array.pop(month_pnl)
        array.pop(bench_month_pnl)
        array.pop(month_time)

if array.size(year_time) > 0
    if year(time) == year(array.get(year_time, array.size(year_time) - 1))
        array.pop(year_pnl)
        array.pop(bench_year_pnl)
        array.pop(year_time)

if (time >= from_date)
    array.push(month_time, time)
    array.push(year_time,  time)

    array.push(month_pnl, cur_month_pnl)
    array.push(year_pnl,  cur_year_pnl)

    array.push(bench_year_pnl,  bench_cur_year_pnl)
    array.push(bench_month_pnl, bench_cur_month_pnl)

// Monthly P&L Table
var monthly_table = table(na)

if array.size(year_pnl) > 0 and barstate.islastconfirmedhistory

    monthly_table := table.new(position.bottom_right, columns=15, rows=array.size(year_pnl) * 3 + 5, border_width=1)

    // Fill monthly performance

    table.cell(monthly_table, 0, 0,  'Perf', bgcolor = #999999)
    table.cell(monthly_table, 1, 0,  'Jan',  bgcolor = #999999)
    table.cell(monthly_table, 2, 0,  'Feb',  bgcolor = #999999)
    table.cell(monthly_table, 3, 0,  'Mar',  bgcolor = #999999)
    table.cell(monthly_table, 4, 0,  'Apr',  bgcolor = #999999)
    table.cell(monthly_table, 5, 0,  'May',  bgcolor = #999999)
    table.cell(monthly_table, 6, 0,  'Jun',  bgcolor = #999999)
    table.cell(monthly_table, 7, 0,  'Jul',  bgcolor = #999999)
    table.cell(monthly_table, 8, 0,  'Aug',  bgcolor = #999999)
    table.cell(monthly_table, 9, 0,  'Sep',  bgcolor = #999999)
    table.cell(monthly_table, 10, 0, 'Oct',  bgcolor = #999999)
    table.cell(monthly_table, 11, 0, 'Nov',  bgcolor = #999999)
    table.cell(monthly_table, 12, 0, 'Dec',  bgcolor = #999999)
    table.cell(monthly_table, 13, 0, ' ', bgcolor = #999999)
    table.cell(monthly_table, 14, 0, 'Year', bgcolor = #999999)

    max_abs_y = math.max(math.abs(array.max(year_pnl)),  math.abs(array.min(year_pnl)))
    max_abs_m = math.max(math.abs(array.max(month_pnl)), math.abs(array.min(month_pnl)))

    for yi = 0 to array.size(year_pnl) - 1 by 1
        table.cell(monthly_table, 0,  yi + 1, str.tostring(year(array.get(year_time, yi))), bgcolor=#cccccc)
        table.cell(monthly_table, 13, yi + 1, ' ',   bgcolor=#999999)
        y_color = color.from_gradient(array.get(year_pnl, yi), -max_abs_y, max_abs_y, loss_color, prof_color)
        table.cell(monthly_table, 14, yi + 1, str.tostring(math.round(array.get(year_pnl, yi) * 100, prec)), bgcolor=y_color)

    for mi = 0 to array.size(month_time) - 1 by 1
        m_row = year(array.get(month_time, mi)) - year(array.get(year_time, 0)) + 1
        m_col = month(array.get(month_time, mi))
        m_color = color.from_gradient(array.get(month_pnl, mi), -max_abs_m, max_abs_m, loss_color, prof_color)

        table.cell(monthly_table, m_col, m_row, str.tostring(math.round(array.get(month_pnl, mi) * 100, prec)), bgcolor=m_color)

    // Fill benchmark performance
    next_row =  array.size(year_pnl) + 1

    if (disp_bench)

        table.cell(monthly_table, 0,  next_row, 'Bench', bgcolor=#999999)
        table.cell(monthly_table, 1,  next_row, 'Jan',   bgcolor=#999999)
        table.cell(monthly_table, 2,  next_row, 'Feb',   bgcolor=#999999)
        table.cell(monthly_table, 3,  next_row, 'Mar',   bgcolor=#999999)
        table.cell(monthly_table, 4,  next_row, 'Apr',   bgcolor=#999999)
        table.cell(monthly_table, 5,  next_row, 'May',   bgcolor=#999999)
        table.cell(monthly_table, 6,  next_row, 'Jun',   bgcolor=#999999)
        table.cell(monthly_table, 7,  next_row, 'Jul',   bgcolor=#999999)
        table.cell(monthly_table, 8,  next_row, 'Aug',   bgcolor=#999999)
        table.cell(monthly_table, 9,  next_row, 'Sep',   bgcolor=#999999)
        table.cell(monthly_table, 10, next_row, 'Oct',   bgcolor=#999999)
        table.cell(monthly_table, 11, next_row, 'Nov',   bgcolor=#999999)
        table.cell(monthly_table, 12, next_row, 'Dec',   bgcolor=#999999)
        table.cell(monthly_table, 13, next_row, ' ',     bgcolor = #999999)
        table.cell(monthly_table, 14, next_row, 'Year',  bgcolor=#999999)

        max_bench_abs_y = math.max(math.abs(array.max(bench_year_pnl)),  math.abs(array.min(bench_year_pnl)))
        max_bench_abs_m = math.max(math.abs(array.max(bench_month_pnl)), math.abs(array.min(bench_month_pnl)))

        for yi = 0 to array.size(year_time) - 1 by 1
            table.cell(monthly_table, 0,  yi + 1 + next_row + 1, str.tostring(year(array.get(year_time, yi))), bgcolor=#cccccc)
            table.cell(monthly_table, 13, yi + 1 + next_row + 1, ' ',   bgcolor=#999999)
            y_color = color.from_gradient(array.get(bench_year_pnl, yi), -max_bench_abs_y, max_bench_abs_y, loss_color, prof_color)
            table.cell(monthly_table, 14, yi + 1 + next_row + 1, str.tostring(math.round(array.get(bench_year_pnl, yi) * 100, prec)), bgcolor=y_color)

        for mi = 0 to array.size(month_time) - 1 by 1
            m_row = year(array.get(month_time, mi)) - year(array.get(year_time, 0)) + 1
            m_col = month(array.get(month_time, mi))
            m_color = color.from_gradient(array.get(bench_month_pnl, mi), -max_bench_abs_m, max_bench_abs_m, loss_color, prof_color)

            table.cell(monthly_table, m_col, m_row  + next_row + 1, str.tostring(math.round(array.get(bench_month_pnl, mi) * 100, prec)), bgcolor=m_color)

    // Fill Alpha
    if (disp_alpha)

        next_row :=  array.size(year_pnl) * 2 + 3
        table.cell(monthly_table, 0,  next_row, 'Alpha', bgcolor=#999999)
        table.cell(monthly_table, 1,  next_row, 'Jan',   bgcolor=#999999)
        table.cell(monthly_table, 2,  next_row, 'Feb',   bgcolor=#999999)
        table.cell(monthly_table, 3,  next_row, 'Mar',   bgcolor=#999999)
        table.cell(monthly_table, 4,  next_row, 'Apr',   bgcolor=#999999)
        table.cell(monthly_table, 5,  next_row, 'May',   bgcolor=#999999)
        table.cell(monthly_table, 6,  next_row, 'Jun',   bgcolor=#999999)
        table.cell(monthly_table, 7,  next_row, 'Jul',   bgcolor=#999999)
        table.cell(monthly_table, 8,  next_row, 'Aug',   bgcolor=#999999)
        table.cell(monthly_table, 9,  next_row, 'Sep',   bgcolor=#999999)
        table.cell(monthly_table, 10, next_row, 'Oct',   bgcolor=#999999)
        table.cell(monthly_table, 11, next_row, 'Nov',   bgcolor=#999999)
        table.cell(monthly_table, 12, next_row, 'Dec',   bgcolor=#999999)
        table.cell(monthly_table, 13, next_row, '',      bgcolor=#999999)
        table.cell(monthly_table, 14, next_row, 'Year',  bgcolor=#999999)

        max_alpha_abs_y = 0.0
        for yi = 0 to array.size(year_time) - 1 by 1
            if (math.abs(array.get(year_pnl, yi)  - array.get(bench_year_pnl, yi)) > max_alpha_abs_y)
                max_alpha_abs_y := math.abs(array.get(year_pnl, yi)  - array.get(bench_year_pnl, yi))

        max_alpha_abs_m = 0.0
        for mi = 0 to array.size(month_pnl) - 1 by 1
            if (math.abs(array.get(month_pnl, mi) - array.get(bench_month_pnl, mi)) > max_alpha_abs_m)
                max_alpha_abs_m := math.abs(array.get(month_pnl, mi) - array.get(bench_month_pnl, mi))

        for yi = 0 to array.size(year_time) - 1 by 1
            table.cell(monthly_table, 0,  yi + 1 + next_row + 1, str.tostring(year(array.get(year_time, yi))), bgcolor=#cccccc)
            table.cell(monthly_table, 13, yi + 1 + next_row + 1, ' ',   bgcolor=#999999)
            y_color = color.from_gradient(array.get(year_pnl, yi)  - array.get(bench_year_pnl, yi), -max_alpha_abs_y, max_alpha_abs_y, loss_color, prof_color)
            table.cell(monthly_table, 14, yi + 1 + next_row + 1, str.tostring(math.round((array.get(year_pnl, yi)  - array.get(bench_year_pnl, yi)) * 100, prec)), bgcolor=y_color)

        for mi = 0 to array.size(month_time) - 1 by 1
            m_row = year(array.get(month_time, mi)) - year(array.get(year_time, 0)) + 1
            m_col = month(array.get(month_time, mi))
            m_color = color.from_gradient(array.get(month_pnl, mi) - array.get(bench_month_pnl, mi), -max_alpha_abs_m, max_alpha_abs_m, loss_color, prof_color)

            table.cell(monthly_table, m_col, m_row  + next_row + 1, str.tostring(math.round((array.get(month_pnl, mi) - array.get(bench_month_pnl, mi)) * 100, prec)), bgcolor=m_color)