Stratégie de chasseur de tendances multi-périodes

Aperçu
La stratégie de chasseur de tendances à plusieurs périodes (Multitimeframe Trend Hunter Strategy) est une stratégie qui utilise plusieurs indicateurs en combinaison avec des signaux de trading automatisés. Cette stratégie utilise des moyennes mobiles, des indicateurs de tendance super et des indicateurs de graphique en nuage, etc., pour juger de la direction de la tendance dans plusieurs périodes afin de découvrir des opportunités de trading potentielles.
Principe de stratégie
Le principe central de la stratégie est de déterminer la direction de la tendance à la fois dans les périodes de temps élevées et basses. La stratégie calcule d'abord les moyennes mobiles critiques, les lignes de tendance supérieures et les lignes de conversion, les lignes de référence, etc. d'un graphique de nuage dans la période de temps élevée.
Une fois que certaines conditions sont remplies, la stratégie génère un signal de transaction d'achat ou de vente. L'utilisateur peut choisir de négocier uniquement des ordres longs, des ordres courts ou des ordres entiers en fonction de ses besoins. De plus, l'utilisateur peut configurer des paramètres de moyenne mobile, des paramètres de super tendances, des paramètres de diagramme en nuage, etc., pour optimiser la performance de la stratégie.
Analyse des avantages
Le plus grand avantage de cette stratégie réside dans la combinaison de plusieurs périodes et de plusieurs indicateurs, ce qui permet d'améliorer considérablement l'exactitude de la direction de la tendance et de détecter rapidement les occasions de renversement. Les avantages spécifiques sont les suivants:
- Utilisez les cadres horaires pour identifier les tendances et éviter d'être trompé par le bruit du marché
- Les moyennes mobiles sont utilisées comme indicateur de ligne moyenne et longue pour déterminer les principales tendances
- La ligne de super-tendance comme indicateur à court terme pour saisir en temps opportun le renversement de tendance
- Une carte nuageuse pour détecter les zones de résistance et les opportunités potentielles
Analyse des risques
Les principaux risques de cette stratégie sont que les paramètres mal configurés peuvent entraîner des transactions trop fréquentes ou des opportunités manquées. De plus, les indicateurs émettant de faux signaux peuvent également entraîner des pertes. Les risques spécifiques et les solutions sont les suivants:
- Risque de paramétrage: faire beaucoup de retours et d'optimisation pour trouver la meilleure combinaison de paramètres
- Risque de faux signaux: vérifier avec plus d'indicateurs pour éviter les faux signaux
- Risques de retrait: adaptation de la gestion des positions et maîtrise des pertes individuelles
Direction d'optimisation
Il y a encore de la place pour optimiser cette stratégie:
- Ajout de plus de combinaisons d'indicateurs, comme les bandes de Brin, le RSI, etc., pour une meilleure précision de jugement
- Des modèles d'apprentissage automatique intégrés pour des stratégies de trading plus intelligentes
- La combinaison de techniques quantifiées, telles que le trading à haute fréquence et les "early birds", pour améliorer encore la performance de la stratégie
- Optimisation des stratégies de gestion des positions, afin de réduire le risque de retrait en ajustant les positions de manière dynamique
Résumer
En résumé, la stratégie de chasseur de tendance à plusieurs périodes utilise plusieurs indicateurs et plusieurs périodes pour juger des tendances et saisir les opportunités de revers en temps opportun. C'est une stratégie de trading quantitatif qui fonctionne bien. La stratégie est hautement intégrée, largement utilisée et offre encore beaucoup de possibilités d'optimisation à l'avenir.
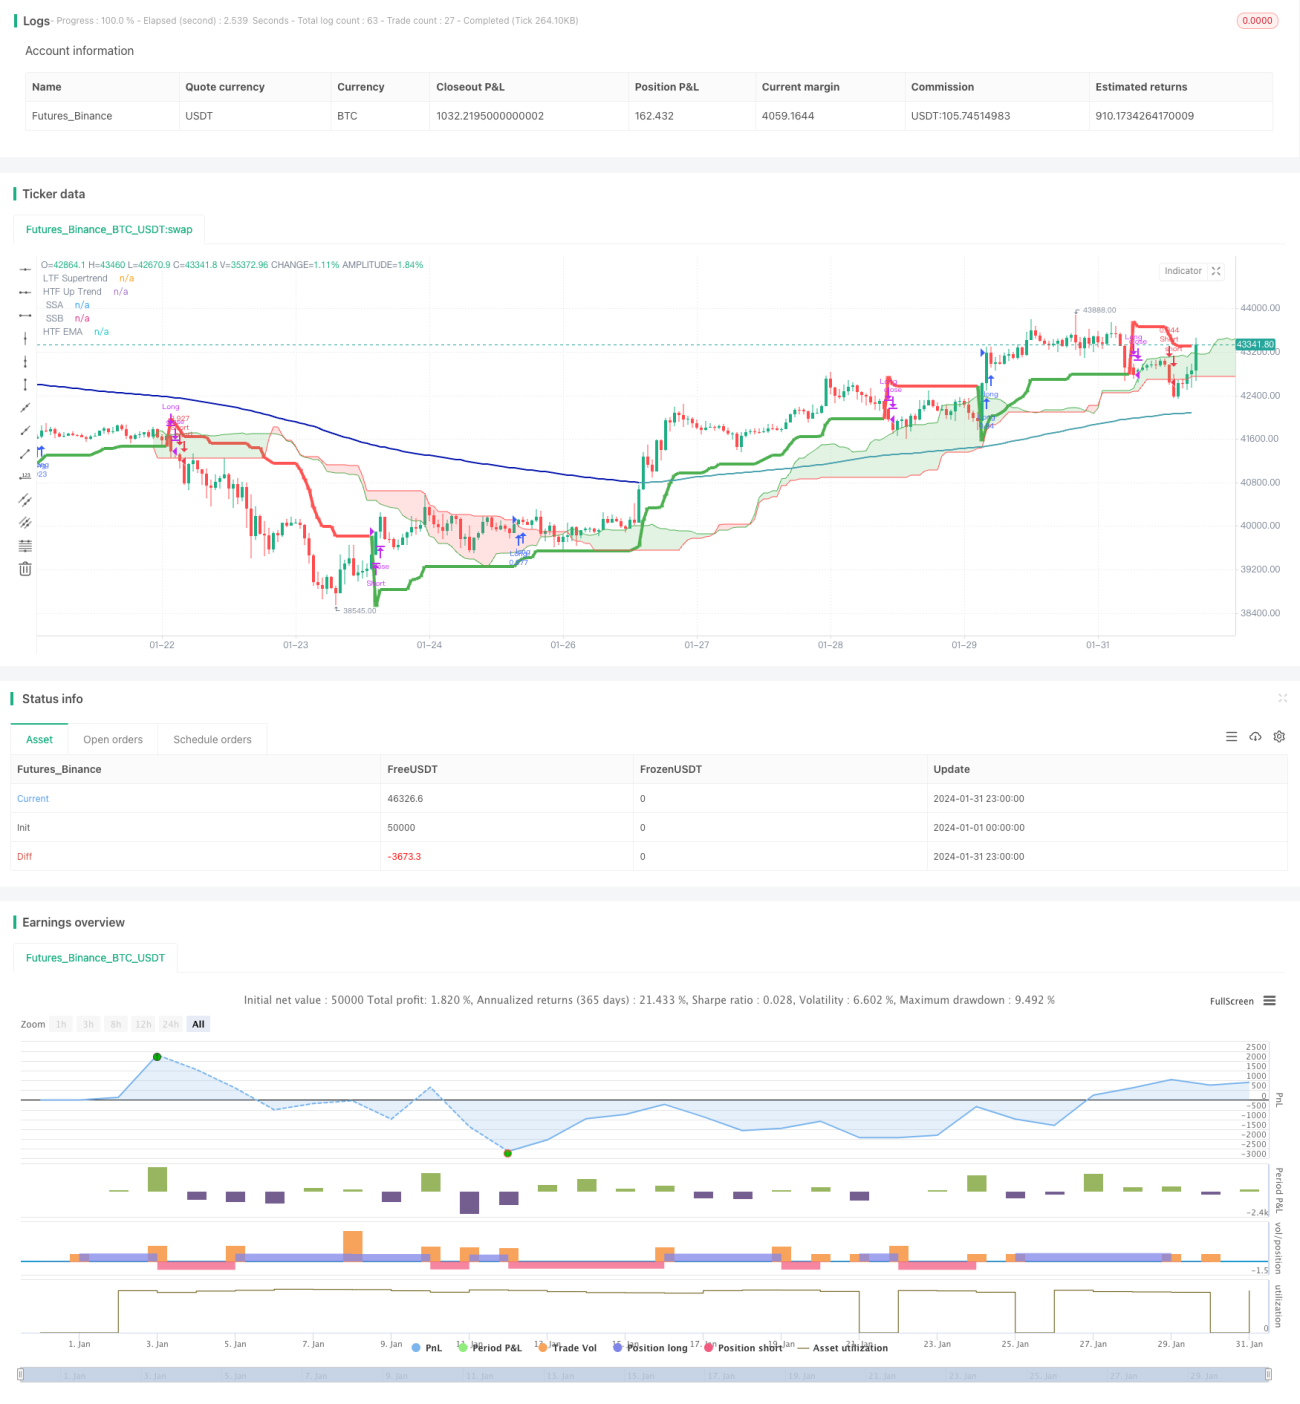
/*backtest
start: 2024-01-01 00:00:00
end: 2024-01-31 23:59:59
period: 1h
basePeriod: 15m
exchanges: [{"eid":"Futures_Binance","currency":"BTC_USDT"}]
*/

// This Pine Script™ code is subject to the terms of the Mozilla Public License 2.0 at https://mozilla.org/MPL/2.0/
// © godzcopilot / blockybears

// Thanks to anthonyf50 for his MTF Ichimoku https://www.tradingview.com/script/Pw9cBFma/- 1