Une nouvelle stratégie de trading quantitative basée sur le modèle ABCD avec stop loss et take profit
Une vue d’ensemble de la stratégie
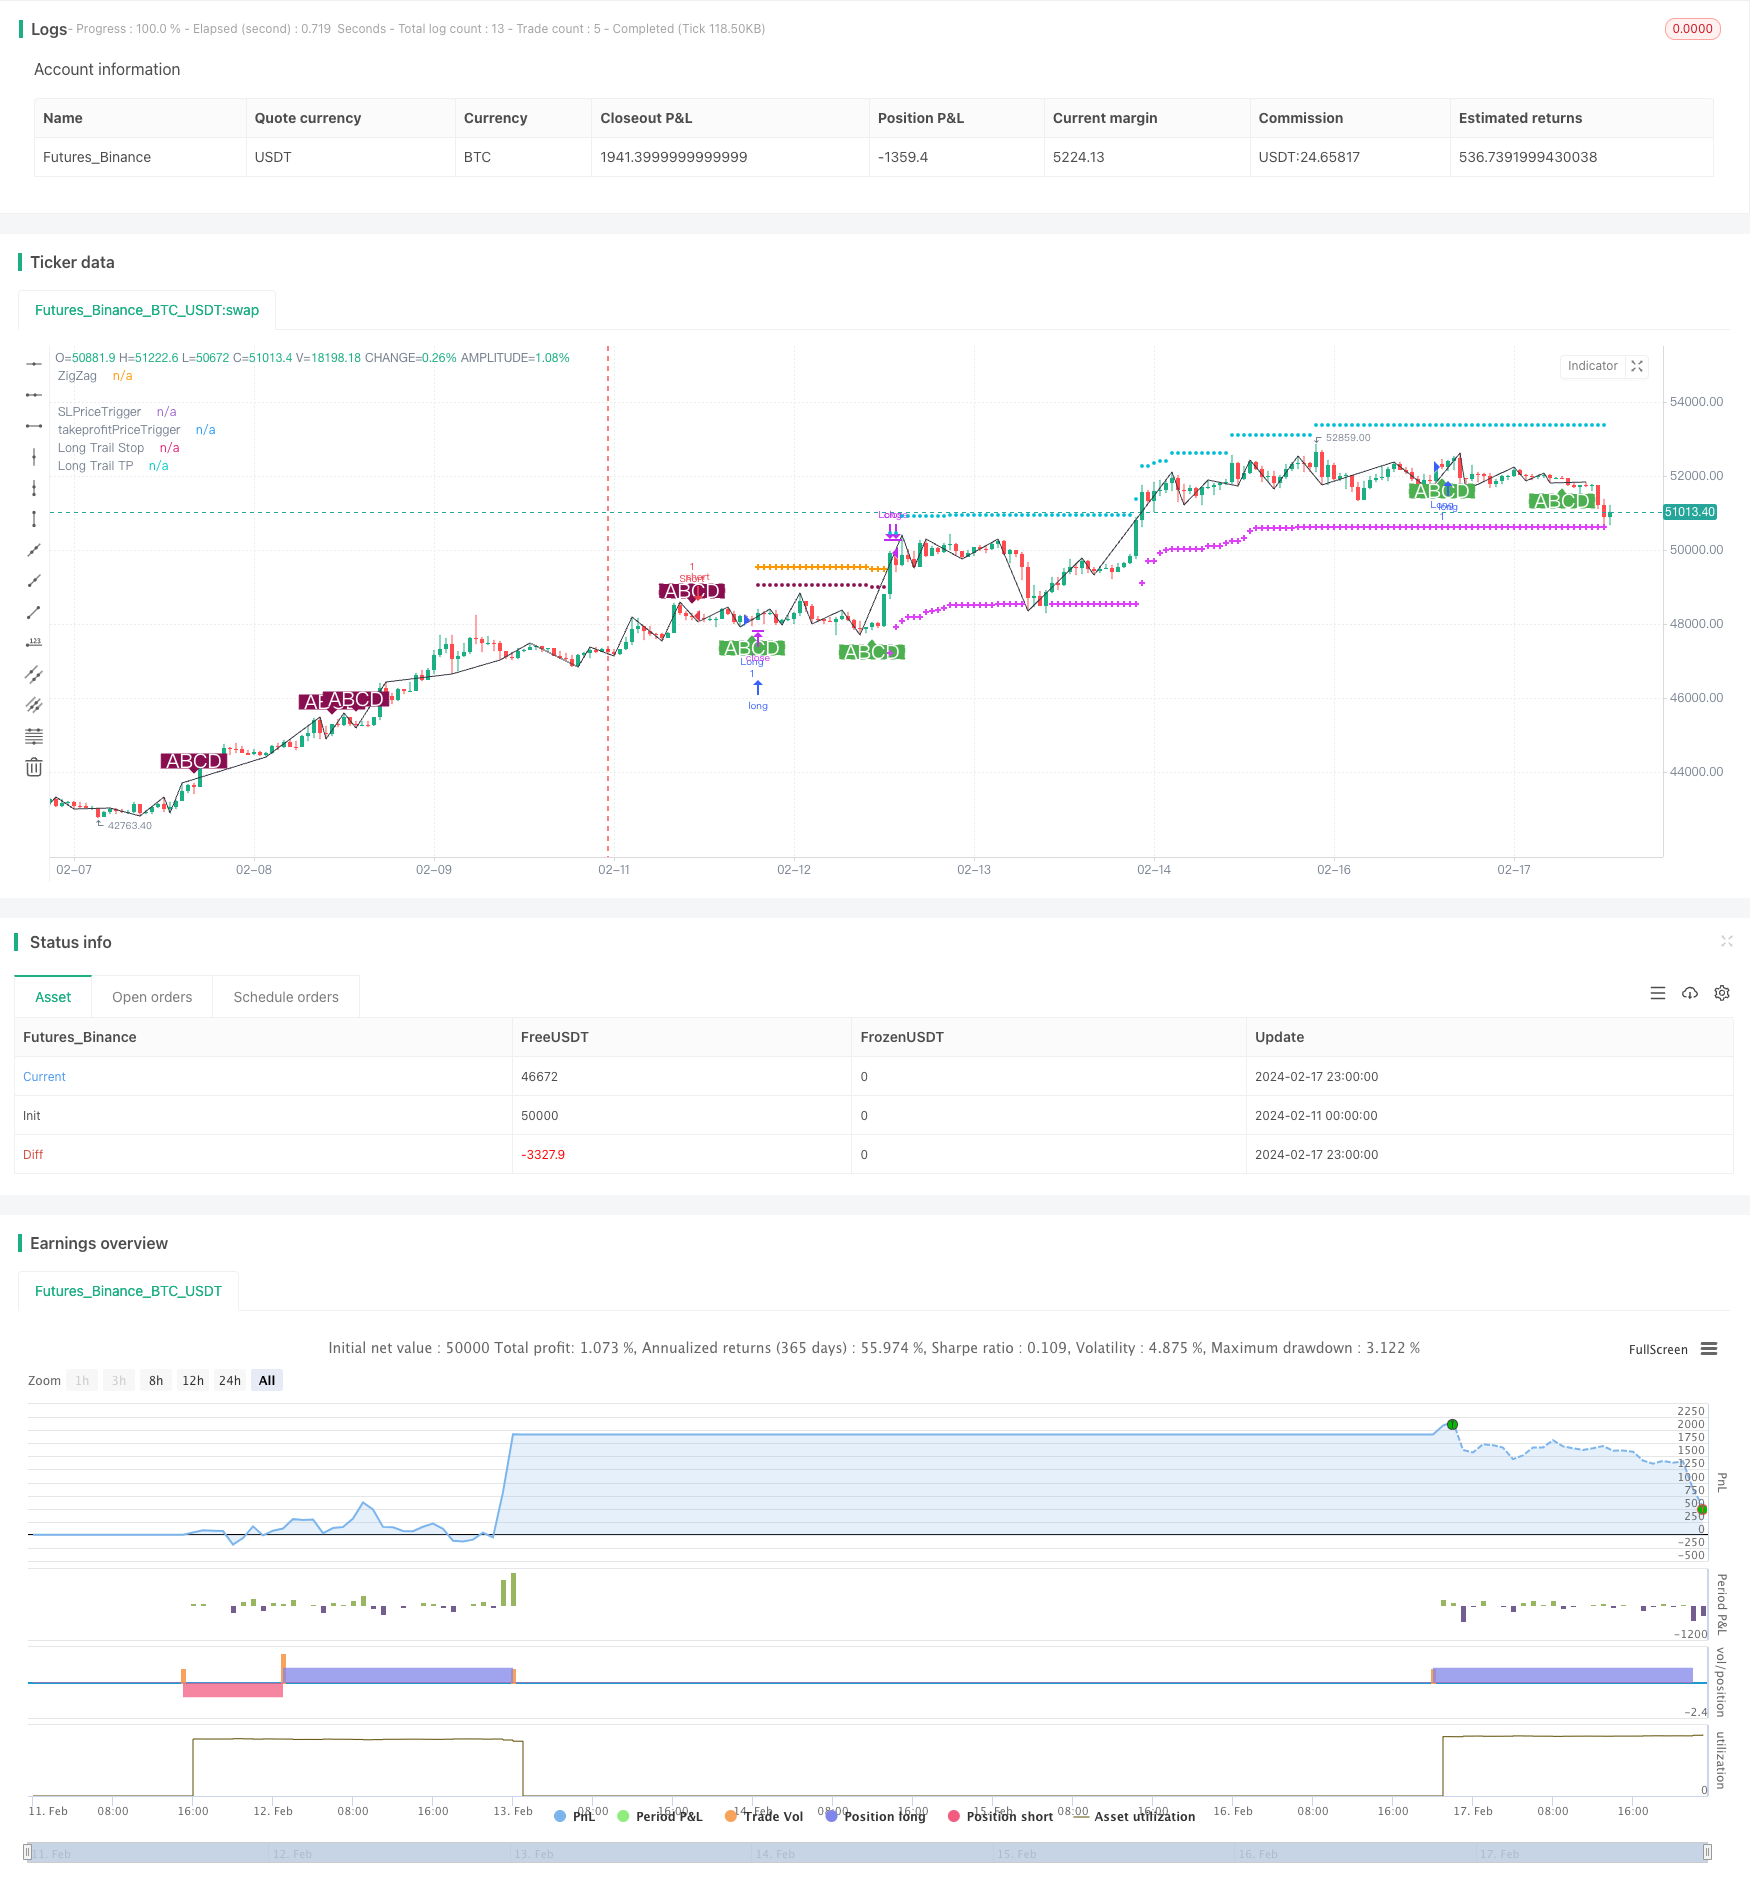
La stratégie est appelée la meilleure stratégie de trading ABCD avec suivi des arrêts et des arrêts. Il s’agit d’une stratégie quantifiée pour effectuer des opérations de trading basées sur un modèle de forme de prix ABCD bien défini. L’idée principale est d’identifier le modèle de forme ABCD complet, de faire plus de blanchiment en fonction de la direction de la forme et de configurer un suivi des arrêts et des arrêts pour gérer les positions.
2. Principes de la stratégie
Utilisez le jugement assisté de Brin pour identifier les points de classement supérieurs et inférieurs du prix, obtenant une courbe ZigZag du prix.
Pour identifier un modèle de forme ABCD complet sur la courbe ZigZag, les quatre points A, B, C et D doivent satisfaire à un certain rapport de proportion. Après avoir identifié la forme ABCD admissible, faire plus ou faire moins.
Après avoir effectué plusieurs prises de position, réglez le suivi des pertes pour contrôler les risques. Utilisez un stop-loss fixe au début des pertes, puis un stop-loss mobile pour verrouiller une partie des bénéfices lorsque les gains atteignent un certain pourcentage.
De la même manière, le stop-loss est également réglé en fonction de la traçabilité, afin d’arrêter le stop-loss en temps opportun après avoir obtenu suffisamment de bénéfices pour éviter le retour des bénéfices. Le stop-loss tracking est également divisé en deux phases, d’abord avec un stop-loss fixe pour obtenir une partie des bénéfices, puis en passant à un stop-loss mobile pour continuer à suivre les prix.
Lorsque le prix déclenche un stop-loss ou un stop-loss mobile, éliminez la position pour terminer un cycle de négociation.
Troisièmement, analyser les forces stratégiques
L’utilisation du jugement assisté de Brin pour identifier la courbe ZigZag évite les problèmes de régression de la courbe ZigZag traditionnelle et rend le signal de transaction plus fiable.
Le modèle de transaction ABCD est mature et stable, les opportunités de transaction sont abondantes. Et la direction de la forme ABCD est claire, il est facile de juger de la direction de la mise en marché.
La mise en place d’un suivi de stop-loss en deux étapes permet de mieux contrôler le risque et de réaliser des bénéfices. Le stop-loss mobile permet une plus grande flexibilité de la stratégie.
Les paramètres de stratégie sont conçus de manière rationnelle, le pourcentage de stop-loss et le pourcentage de démarrage mobile peuvent être personnalisés et sont utilisés de manière flexible.
Cette stratégie peut être utilisée pour n’importe quelle variété, y compris les devises, les crypto-monnaies et les indices boursiers.
Quatrièmement, analyse stratégique des risques
Le format ABCD est plus clair, mais les opportunités de trading sont relativement limitées et ne garantissent pas une fréquence de trading suffisante.
En cas de tremblement de terre, il peut arriver que l’arrêt de perte soit fréquemment déclenché. Il est alors nécessaire d’ajuster les paramètres de manière appropriée pour élargir la portée de l’arrêt de perte.
Il est nécessaire de se concentrer sur la liquidité des variétés de négociation elles-mêmes.
Les stratégies sont sensibles aux coûts de transaction et nécessitent de choisir des courtiers et des comptes avec des frais de transaction peu élevés.
Certains paramètres peuvent être optimisés, comme les conditions de démarrage de stop-loss et d’arrêt mobiles, qui permettent de tester plus de valeurs pour trouver le meilleur point de repère.
Cinquièmement, améliorer la stratégie
Il est possible de combiner d’autres indicateurs et de définir des conditions de filtrage supplémentaires pour éviter une partie de la forme HW. Cela peut réduire l’apparition de transactions invalides.
Augmenter le jugement sur la structure en trois segments du marché, en cherchant des opportunités de négociation uniquement dans le troisième segment. Cela peut améliorer le taux de victoire de la stratégie.
Les tests permettent d’optimiser la taille de l’investissement initial et de trouver le meilleur niveau de capital initial. Trop grand, trop petit ne vous permettra pas d’obtenir le meilleur taux de rendement.
Les données extra-échantillon peuvent être testées pour vérifier la robustesse des paramètres. Ceci est essentiel pour la stabilité à long terme de la stratégie.
Continuer à optimiser les conditions de démarrage et de démarrage de stop/stop mobile et la taille des points de glissement pour améliorer l’efficacité de l’exécution de la stratégie.
Sixièmement, un résumé de la stratégie
La stratégie repose principalement sur la forme du prix ABCD pour le jugement et l’introduction sur le marché. La mise en place d’un suivi de stop-loss en deux étapes pour gérer les risques et les gains. La stratégie est relativement stable à l’âge adulte, mais la fréquence des transactions peut être faible.
/*backtest
start: 2024-02-11 00:00:00
end: 2024-02-18 00:00:00
period: 1h
basePeriod: 15m
exchanges: [{"eid":"Futures_Binance","currency":"BTC_USDT"}]
*/

// @version=4
// @author=Daveatt - BEST

// ABCD Pattern Strat

StrategyName        = "BEST ABCD Pattern Strategy (Trailing SL + TP)"
ShortStrategyName   = "BEST ABCD Strategy (Trailing)"

strategy(title=StrategyName, shorttitle=ShortStrategyName, overlay=true )

filterBW = input(false, title="filter Bill Williams Fractals?")

///////////////////////////////////////////////////////////////////////////////
///////////////////////////////////////////////////////////////////////////////
///////////////////////////////// UTILITIES ///////////////////////////////////
///////////////////////////////////////////////////////////////////////////////
///////////////////////////////////////////////////////////////////////////////

//  ||-----------------------------------------------------------------------------------------------------||
//  ||---   Fractal Recognition Functions:  ---------------------------------------------------------------||
isRegularFractal(mode, _high, _low) =>
    ret = mode == 1 ? _high[4] < _high[3] and _high[3] < _high[2] and _high[2] > _high[1] and _high[1] > _high[0] :
     mode == -1 ? _low[4] > _low[3] and _low[3] > _low[2] and _low[2] < _low[1] and _low[1] < _low[0] : false

isBWFractal(mode, _high, _low) =>
    ret = mode == 1 ? _high[4] < _high[2] and _high[3] <= _high[2] and _high[2] >= _high[1] and _high[2] > _high[0] :
     mode == -1 ? _low[4] > _low[2] and _low[3] >= _low[2] and _low[2] <= _low[1] and _low[2] < _low[0] : false

///////////////////////////////////////////////////////////////////////////////
///////////////////////////////////////////////////////////////////////////////
////////////////////////////// ABCD PATTERN ///////////////////////////////////
///////////////////////////////////////////////////////////////////////////////
///////////////////////////////////////////////////////////////////////////////

f_abcd()=>

    _r = timeframe.period
    _g = barmerge.gaps_off
    _l = barmerge.lookahead_on

    _high = high
    _low = low

    filteredtopf = filterBW ? isRegularFractal(1, _high, _low) : isBWFractal(1, _high, _low)
    filteredbotf = filterBW ? isRegularFractal(-1, _high, _low) : isBWFractal(-1, _high, _low)

    //  ||---   ZigZag:
    istop = filteredtopf
    isbot = filteredbotf
    topcount = barssince(istop)
    botcount = barssince(isbot)

    zigzag = (istop and topcount[1] > botcount[1] ? _high[2] :
     isbot and topcount[1] < botcount[1] ? _low[2] : na)

    x = valuewhen(zigzag, zigzag, 4)
    a = valuewhen(zigzag, zigzag, 3)
    b = valuewhen(zigzag, zigzag, 2)
    c = valuewhen(zigzag, zigzag, 1)
    d = valuewhen(zigzag, zigzag, 0)

    xab = (abs(b-a)/abs(x-a))
    xad = (abs(a-d)/abs(x-a))
    abc = (abs(b-c)/abs(a-b))
    bcd = (abs(c-d)/abs(b-c))

    // ABCD Part
    _abc = abc >= 0.382 and abc <= 0.886
    _bcd = bcd >= 1.13 and bcd <= 2.618

    _bull_abcd = _abc and _bcd and d < c
    _bear_abcd = _abc and _bcd and d > c

    _bull   = _bull_abcd and not _bull_abcd[1]
    _bear   = _bear_abcd and not _bear_abcd[1]

    [_bull, _bear, zigzag]

lapos_x = timenow + round(change(time)*12)

[isLong, isShort, zigzag]  = f_abcd()

plot(zigzag, title= 'ZigZag', color=color.black, offset=-2)
plotshape(isLong, style=shape.labelup, location=location.belowbar, color=color.new(color.green, 0), size=size.normal, text="ABCD", textcolor=color.white)
plotshape(isShort, style=shape.labeldown, location=location.abovebar, color=color.new(color.maroon, 0), size=size.normal, text="ABCD", textcolor=color.white)


long_entry_price    = valuewhen(isLong, close, 0)
short_entry_price   = valuewhen(isShort, close, 0)

sinceNUP = barssince(isLong)
sinceNDN = barssince(isShort)

buy_trend   = sinceNDN > sinceNUP
sell_trend  = sinceNDN < sinceNUP

change_trend = (buy_trend and sell_trend[1]) or (sell_trend and buy_trend[1])

entry_price  = buy_trend ? long_entry_price : short_entry_price

///////////////////////////////
//======[ Trailing STOP ]======//
///////////////////////////////

// use SL?
useSL = input(true, "Use stop Loss")
// Configure trail stop level with input
StopTrailPerc = input(title="Trail Loss (%)", type=input.float, minval=0.0, step=0.1, defval=3) * 0.01
// Will trigger the take profit trailing once reached
use_SL_Trigger = input(true, "Use stop Loss Trigger")
StopTrailTrigger   = input(2.0, "SL Trigger (%)",minval=0,step=0.5,type=input.float) * 0.01


StopLossPriceTrigger = 0.0
StopLossPriceTrigger := if (use_SL_Trigger)
    if buy_trend
        entry_price * (1 + StopTrailTrigger)
    else
        entry_price * (1 - StopTrailTrigger)
else
    -1


var SL_Trigger_Long_HIT = false
SL_Trigger_Long_HIT := useSL and use_SL_Trigger and buy_trend and high >= StopLossPriceTrigger
 ? true : SL_Trigger_Long_HIT[1]


var SL_Trigger_Short_HIT = false
SL_Trigger_Short_HIT := useSL and use_SL_Trigger and sell_trend and low <= StopLossPriceTrigger
 ? true : SL_Trigger_Short_HIT[1]


display_long_SL_trigger     = useSL and buy_trend  and use_SL_Trigger
 and SL_Trigger_Long_HIT == false and StopLossPriceTrigger != -1
display_short_SL_trigger    = useSL and sell_trend and use_SL_Trigger
 and SL_Trigger_Short_HIT == false and StopLossPriceTrigger != -1
display_SL_trigger          = display_long_SL_trigger or display_short_SL_trigger

plot(display_SL_trigger ? StopLossPriceTrigger : na, title='SLPriceTrigger', transp=0,
 color=color.maroon, style=plot.style_circles, linewidth=3)


// Determine trail stop loss prices
longStopPrice = 0.0, shortStopPrice = 0.0

longStopPrice := if useSL and buy_trend
    stopValue = low * (1 - StopTrailPerc)
    max(stopValue, longStopPrice[1])
else
    0

shortStopPrice := if useSL and sell_trend
    stopValue = high * (1 + StopTrailPerc)
    min(stopValue, shortStopPrice[1])
else
    999999

//////////////////////////////////////////////////////////////////////////////////////////
//*** STOP LOSS HIT CONDITIONS  ***//
//////////////////////////////////////////////////////////////////////////////////////////

cond_long_stop_loss_hit  = useSL and buy_trend and crossunder(low, longStopPrice[1])
 and (SL_Trigger_Long_HIT or use_SL_Trigger == false)
cond_short_stop_loss_hit = useSL and sell_trend and crossover(high, shortStopPrice[1])
 and (SL_Trigger_Short_HIT or use_SL_Trigger == false)


// Plot stop loss values for confirmation
plot(series=useSL and buy_trend and low >= longStopPrice
 and (SL_Trigger_Long_HIT or use_SL_Trigger == false)
 ? longStopPrice : na,
 color=color.fuchsia, style=plot.style_cross,
 linewidth=2, title="Long Trail Stop")

plot(series=useSL and sell_trend and high <= shortStopPrice
 and (SL_Trigger_Short_HIT or use_SL_Trigger == false)
 ? shortStopPrice : na,
 color=color.fuchsia, style=plot.style_cross,
 linewidth=2, title="Short Trail Stop")


///////////////////////////////
//======[ Take Profit ]======//
///////////////////////////////

// Use TP?
useTP = input(true, "Use take profit")
// TP trailing
ProfitTrailPerc     = input(1.0, "Trailing Profit (%)",minval=0,step=0.5,type=input.float) * 0.01

use_TP_Trigger = input(true, "Use Take Profit Trigger")
// Will trigger the take profit trailing once reached
takeProfitTrigger   = input(3.0, "Take Profit Trigger (%)",minval=0,step=0.5,type=input.float) * 0.01


// ttp := ttp>tp ? tp : ttp

takeprofitPriceTrigger = 0.0
takeprofitPriceTrigger := if (use_TP_Trigger)
    if (buy_trend)
        entry_price * (1 + takeProfitTrigger)
    else
        entry_price * (1 - takeProfitTrigger)
else
    -1

//plot(entry_price, title='entry_price', transp=100)

var TP_Trigger_Long_HIT = false
TP_Trigger_Long_HIT := useTP and use_TP_Trigger and buy_trend and high >= takeprofitPriceTrigger
 ? true : TP_Trigger_Long_HIT[1]


var TP_Trigger_Short_HIT = false
TP_Trigger_Short_HIT := useTP and use_TP_Trigger and sell_trend and low <= takeprofitPriceTrigger
 ? true : TP_Trigger_Short_HIT[1]


display_long_TP_trigger     = useTP and buy_trend  and TP_Trigger_Long_HIT == false
 and takeprofitPriceTrigger != -1
display_short_TP_trigger    = useTP and sell_trend and TP_Trigger_Short_HIT == false
 and takeprofitPriceTrigger != -1
display_TP_trigger          = display_long_TP_trigger or display_short_TP_trigger


//🔷🔷🔷
// @hugo: Will display the TP trigger as long as not hit
// once the TP trigger is hit, the TP trailing will activate
plot(display_TP_trigger ? takeprofitPriceTrigger : na, title='takeprofitPriceTrigger', transp=0, color=color.orange,
 style=plot.style_cross, linewidth=3)

longTrailTP= 0.0, shortTrailTP = 0.0

// Trailing Profit
// Start trailing once trigger is reached
longTrailTP := if useTP and buy_trend
    tpValue = high * (1 + ProfitTrailPerc)
    max(tpValue, longTrailTP[1])
else
    0

shortTrailTP := if useTP and sell_trend
    tpValue = low * (1 - ProfitTrailPerc)
    min(tpValue, shortTrailTP[1])
else
    999999

//plot(longTrailTP, title='debug longTrailTP', transp=100)
//plot(shortTrailTP, title='debug shortTrailTP', transp=100)

//////////////////////////////////////////////////////////////////////////////////////////
//*** TRAILING TAKE PROFIT HIT CONDITIONS TO BE USED IN ALERTS  ***//
//////////////////////////////////////////////////////////////////////////////////////////


//🔷🔷🔷
// @hugo: I use crossover/crossunder for the alerts to trigger the events only once
cond_long_trail_tp_hit      = useTP and buy_trend   and crossover(high, longTrailTP[1])
 and (TP_Trigger_Long_HIT or use_TP_Trigger == false)
cond_short_trail_tp_hit     = useTP and sell_trend  and crossunder(low, shortTrailTP[1])
 and (TP_Trigger_Short_HIT or use_TP_Trigger == false)
// 🔷🔷🔷


// Plot take profits values for confirmation
// Display the trailing TP until not hit
plot(series= useTP and buy_trend and high <= longTrailTP and
 (TP_Trigger_Long_HIT or use_TP_Trigger == false) ? longTrailTP : na,
 color=color.aqua, style=plot.style_circles,
 linewidth=2, title="Long Trail TP")

plot(series= useTP and sell_trend and low >= shortTrailTP and
 (TP_Trigger_Short_HIT or use_TP_Trigger == false) ? shortTrailTP : na,
 color=color.aqua, style=plot.style_circles,
 linewidth=2, title="Short Trail TP")

close_long  = cond_long_trail_tp_hit or cond_long_stop_loss_hit
close_short = cond_short_trail_tp_hit or cond_short_stop_loss_hit


strategy.entry("Long", 1, when=isLong)
strategy.close("Long", when=close_long)

strategy.entry("Short", 0,  when=isShort)
strategy.close("Short", when=close_short)

if change_trend
    SL_Trigger_Long_HIT := false
    SL_Trigger_Short_HIT := false
    TP_Trigger_Long_HIT := false
    TP_Trigger_Short_HIT := false