Stratégie de trading adaptative basée sur une plateforme de trading quantitative
Aperçu
Cette stratégie est une stratégie de négociation de grille adaptative basée sur une plateforme de trading quantitatif. La stratégie permet la négociation de grille en plaçant des ordres d’achat et de vente à des intervalles égaux dans la grille en définissant une portée de négociation de grille automatique ou manuelle.
Principe de stratégie
Il est possible de calculer automatiquement les prix des hauts et des bas historiques dans une certaine plage comme hauts et bas, ou de définir manuellement des hauts et des bas fixes.
L’écart entre les prix de chaque grille est calculé en fonction du nombre de grilles et du prix de la grille supérieure et inférieure.
Il s’agit d’une grille de points de vente et de points d’achat disposés à des intervalles égaux entre les prix des limites supérieures et inférieures.
Lorsque le prix du marché franchit la limite inférieure de la grille, un ordre d’achat est placé dans la grille suivante de la grille où se trouve le dernier ordre de stockage non réglé; lorsque le prix du marché franchit la limite supérieure de la grille, un ordre de vente est placé dans la grille où se trouve le dernier ordre de stockage non réglé.
Ainsi, il y a un achat et une vente continu entre les limites inférieures de la grille. Lorsque la tendance des prix est inversée, les ordres précédents s’arrêtent ou s’arrêtent progressivement.
Avantages stratégiques
Le trading sur grille peut être rentable en cas de volatilité et de volatilité.
Il s’adapte à l’étendue de la grille et peut être ajusté automatiquement en fonction des fluctuations du marché, sans intervention humaine.
Le montant de l’investissement peut être prédéterminé, réparti proportionnellement sur les grilles, afin de contrôler chaque risque.
La logique est simple, facile à comprendre, et les paramètres sont flexibles.
Risques et contre-mesures
Les pertes liées à la rupture de la limite supérieure et inférieure
- Solution: Réalisez un arrêt de perte raisonnable.
La tendance est à la perte de revenus.
- Solution: identifier les tendances et suspendre les transactions en temps opportun
Paramètre mal défini
- Solution: Ajustez le nombre de grilles et les paramètres d’intervalle de prix.
Direction d’optimisation
Utilisez l’apprentissage automatique pour prédire la portée et la tendance des fluctuations des prix et ajustez dynamiquement les paramètres de la grille.
En cas de tendance, il est préférable d’opter pour la tendance et d’éviter les pertes de la grille.
Contrôle des risques en combinant des indicateurs tels que le taux d’utilisation des fonds et le taux de rendement.
La variété est en train de se répandre, les fonds sont en train d’élargir leur portée.
Résumer
Cette stratégie est une stratégie de grille d’adaptation aux paramètres qui peut être ajustée automatiquement, qui s’applique aux actions, aux monnaies numériques et aux variétés de devises qui sont en train de se déplacer sur le plan horizontal, qui peut s’adapter aux différentes situations du marché en ajustant les paramètres de paramètres, et qui a une certaine valeur de combat.
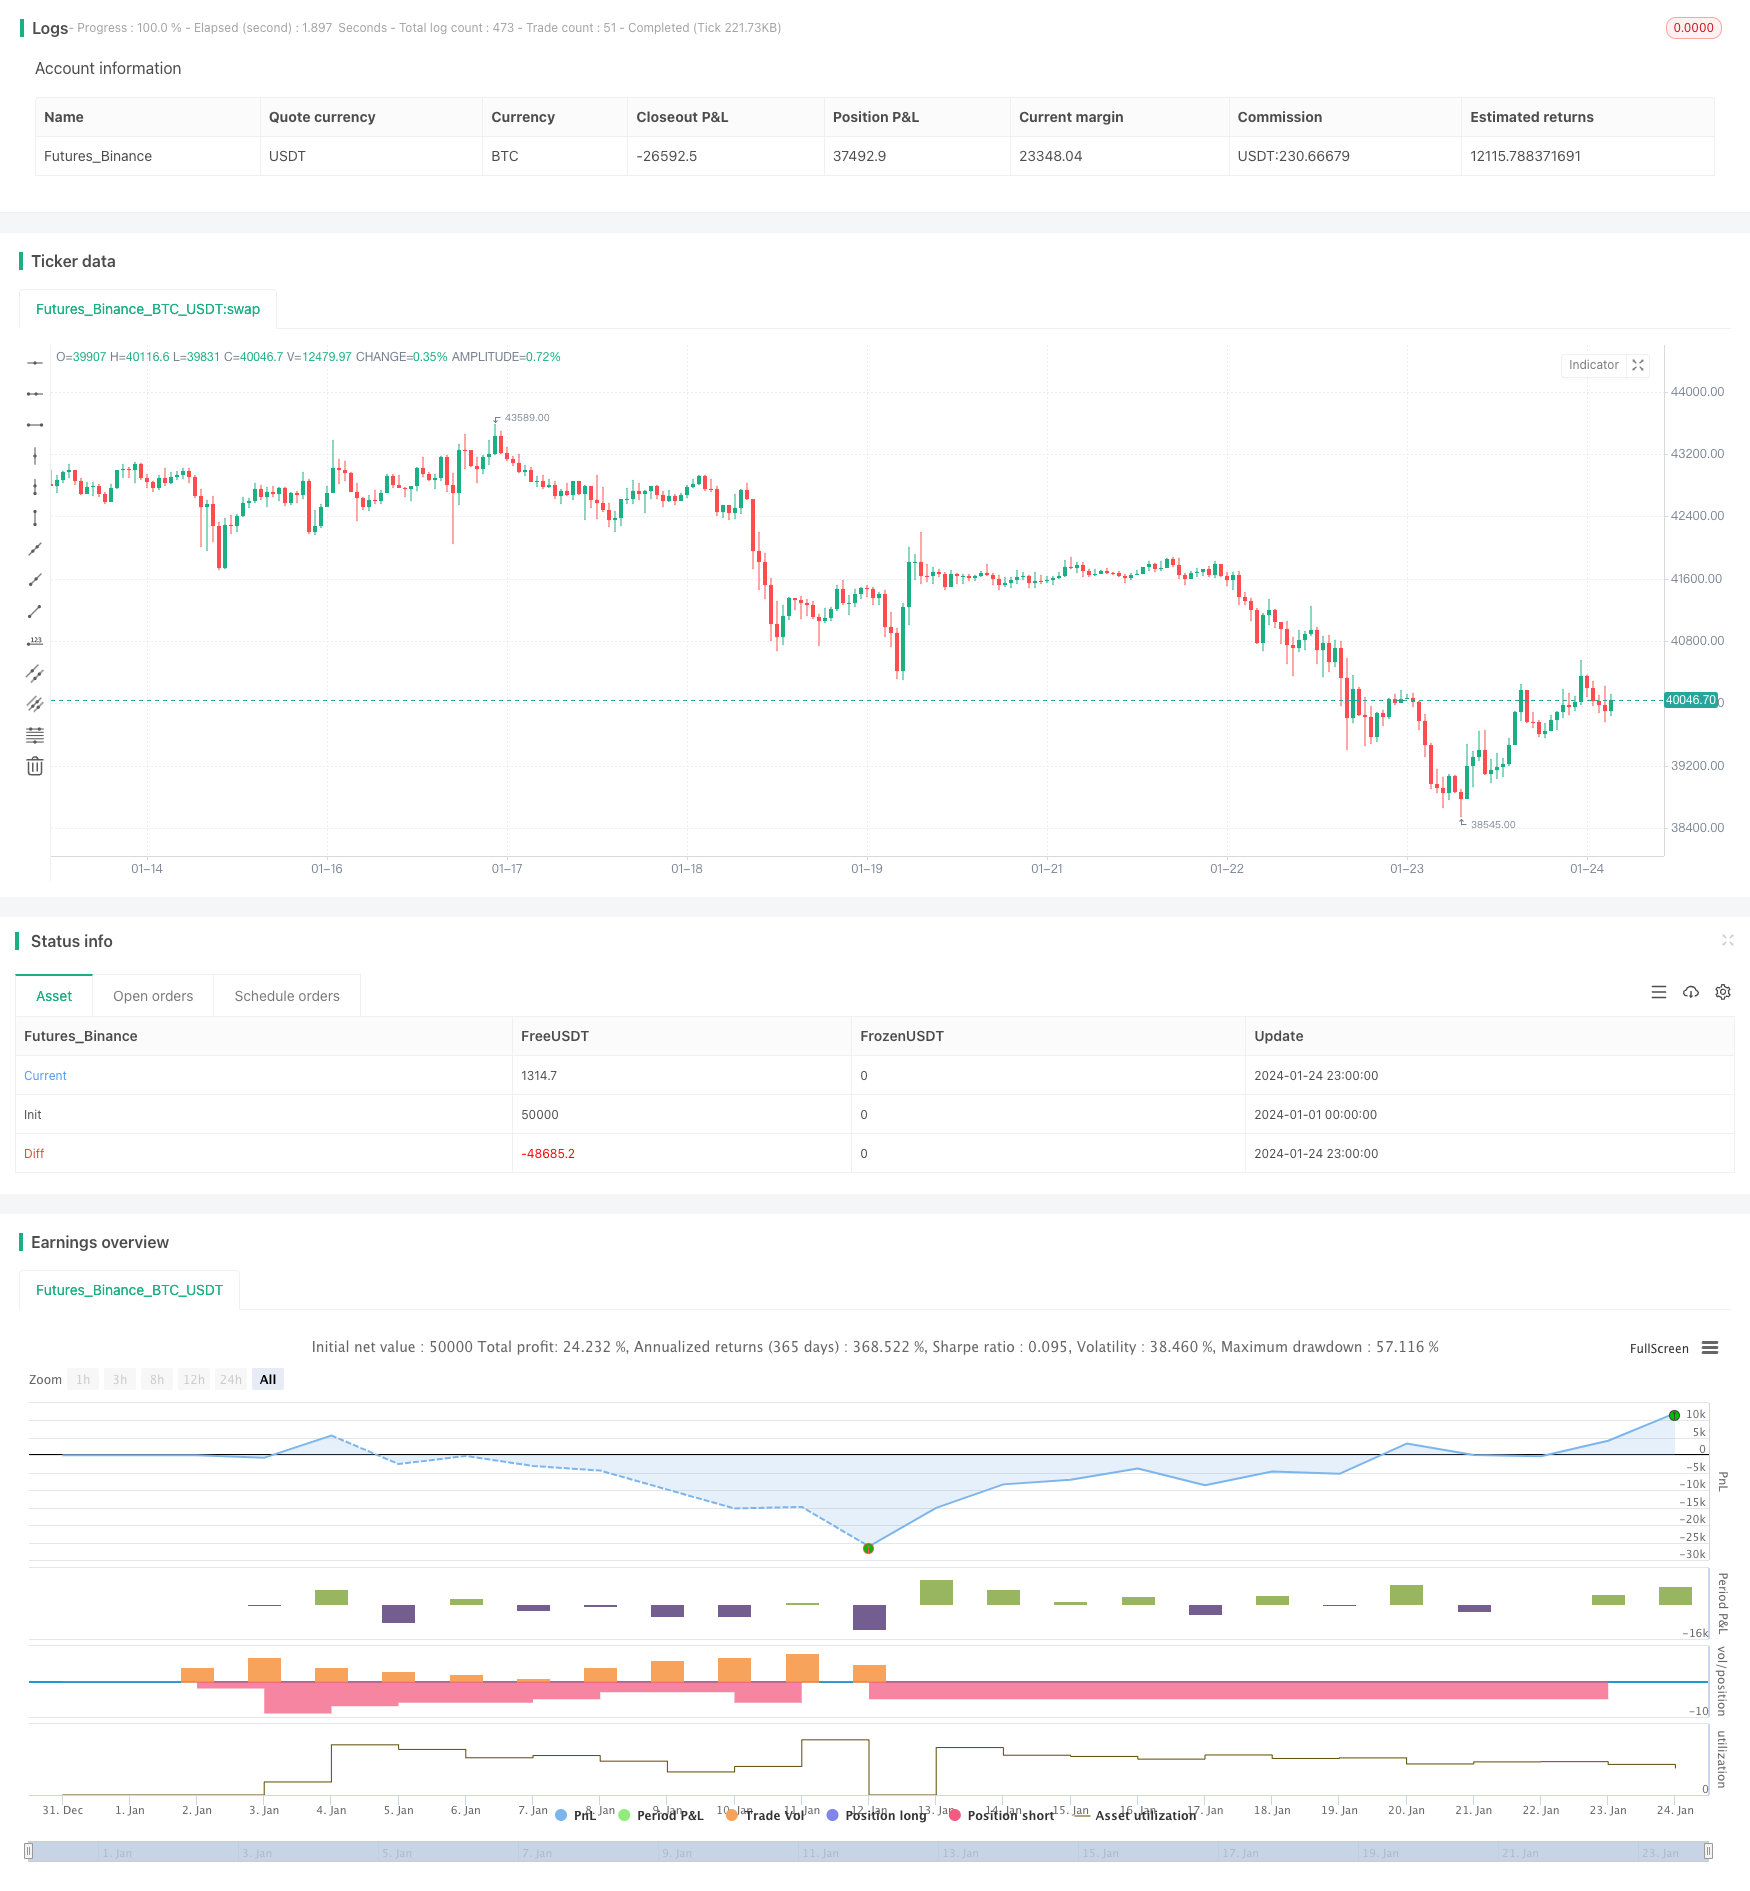
/*backtest
start: 2024-01-01 00:00:00
end: 2024-01-24 23:59:59
period: 1h
basePeriod: 15m
exchanges: [{"eid":"Futures_Binance","currency":"BTC_USDT"}]
*/

//@version=4
//hk4jerry

strategy("Grid Bot Backtesting", overlay=false, pyramiding=3000, close_entries_rule="ANY", default_qty_type=strategy.cash, initial_capital=100.0, currency="USD", commission_type=strategy.commission.percent, commission_value=0.025)
i_autoBounds    = input(group="Grid Bounds", title="Use Auto Bounds?", defval=true, type=input.bool)                             // calculate upper and lower bound of the grid automatically? This will theorhetically be less profitable, but will certainly require less attention
i_boundSrc      = input(group="Grid Bounds", title="(Auto) Bound Source", defval="Hi & Low", options=["Hi & Low", "Average"])     // should bounds of the auto grid be calculated from recent High & Low, or from a Simple Moving Average
i_boundLookback = input(group="Grid Bounds", title="(Auto) Bound Lookback", defval=250, type=input.integer, maxval=500, minval=0) // when calculating auto grid bounds, how far back should we look for a High & Low, or what should the length be of our sma
i_boundDev      = input(group="Grid Bounds", title="(Auto) Bound Deviation", defval=0.10, type=input.float, maxval=1, minval=-1)  // if sourcing auto bounds from High & Low, this percentage will (positive) widen or (negative) narrow the bound limits. If sourcing from Average, this is the deviation (up and down) from the sma, and CANNOT be negative.
i_upperBound    = input(group="Grid Bounds", title="(Manual) Upper Boundry(상단 가격)", defval=0.285, type=input.float)                      // for manual grid bounds only. The upperbound price of your grid
i_lowerBound    = input(group="Grid Bounds", title="(Manual) Lower Boundry(하단 가격)", defval=0.225, type=input.float)                      // for manual grid bounds only. The lowerbound price of your grid.
i_gridQty       = input(group="Grid Lines",  title="Grid Line Quantity(그리드 수)", defval=30, maxval=999, minval=1, type=input.integer)       // how many grid lines are in your grid
initial_balance = input(group="Trading option", title="Initial balance(투자금액)", defval=100, step=0.01)


start_time = input(group="Trading option",defval=timestamp('15 March 2023 06:00'), title='Start Time', type = input.time)
end_time = input(group="Trading option",defval=timestamp('31 Dec 2035 20:00'), title='End Time', type = input.time)
isAfterStartDate = true

tradingtime= (timenow - start_time)/(86400000*30)
yeartime=tradingtime/12


f_getGridBounds(_bs, _bl, _bd, _up) =>
    if _bs == "Hi & Low"
        _up ? highest(close, _bl) * (1 + _bd) : lowest(close, _bl)  * (1 - _bd)
    else
        avg = sma(close, _bl)
        _up ? avg * (1 + _bd) : avg * (1 - _bd)

f_buildGrid(_lb, _gw, _gq) =>
    gridArr = array.new_float(0)
    for i=0 to _gq-1
        array.push(gridArr, _lb+(_gw*i))
    gridArr

f_getNearGridLines(_gridArr, _price) =>
    arr = array.new_int(3)
    for i = 0 to array.size(_gridArr)-1
        if array.get(_gridArr, i) > _price
            array.set(arr, 0, i == array.size(_gridArr)-1 ? i : i+1)
            array.set(arr, 1, i == 0 ? i : i-1)
            break
    arr

var upperBound      = i_autoBounds ? f_getGridBounds(i_boundSrc, i_boundLookback, i_boundDev, true) : i_upperBound  // upperbound of our grid
var lowerBound      = i_autoBounds ? f_getGridBounds(i_boundSrc, i_boundLookback, i_boundDev, false) : i_lowerBound // lowerbound of our grid
var gridWidth       = (upperBound - lowerBound)/(i_gridQty-1)                                                       // space between lines in our grid
var gridLineArr     = f_buildGrid(lowerBound, gridWidth, i_gridQty)                                                 // an array of prices that correspond to our grid lines
var orderArr        = array.new_bool(i_gridQty, false)                                                              // a boolean array that indicates if there is an open order corresponding to each grid line

var closeLineArr    = f_getNearGridLines(gridLineArr, close)                                                        // for plotting purposes - an array of 2 indices that correspond to grid lines near price
var nearTopGridLine = array.get(closeLineArr, 0)                                                                    // for plotting purposes - the index (in our grid line array) of the closest grid line above current price
var nearBotGridLine = array.get(closeLineArr, 1)                                                                    // for plotting purposes - the index (in our grid line array) of the closest grid line below current price
if isAfterStartDate
    for i = 0 to (array.size(gridLineArr) - 1)
        if close < array.get(gridLineArr, i) and not array.get(orderArr, i) and i < (array.size(gridLineArr) - 1)
            buyId = i
            array.set(orderArr, buyId, true)
            strategy.entry(id=tostring(buyId), long=true, qty=(initial_balance/(i_gridQty-1))/close, comment="#"+tostring(buyId))
        if close > array.get(gridLineArr, i) and i != 0
            if array.get(orderArr, i-1)
                sellId = i-1
                array.set(orderArr, sellId, false)
                strategy.close(id=tostring(sellId), comment="#"+tostring(sellId))

    if i_autoBounds
        upperBound  := f_getGridBounds(i_boundSrc, i_boundLookback, i_boundDev, true)
        lowerBound  := f_getGridBounds(i_boundSrc, i_boundLookback, i_boundDev, false)
        gridWidth   := (upperBound - lowerBound)/(i_gridQty-1)
        gridLineArr := f_buildGrid(lowerBound, gridWidth, i_gridQty)

    closeLineArr    := f_getNearGridLines(gridLineArr, close)
    nearTopGridLine := array.get(closeLineArr, 0)
    nearBotGridLine := array.get(closeLineArr, 1)


var table table = table.new(position.top_right,6,8, frame_color = color.rgb(255, 255, 255),frame_width = 2,border_width = 2, border_color=color.rgb(255, 255, 255))


//제목
table.cell(table,0,0,"상단 라인 :", bgcolor=color.new(color.black,0),text_color =color.white)
table.cell(table,0,1,"하단 라인 :",bgcolor=color.new(color.black,0),text_color =color.white)
table.cell(table,0,2,"그리드 수 :",bgcolor=color.new(color.black,0),text_color =color.white)
table.cell(table,0,3,"투자금액 :",text_color =color.white,bgcolor=color.new(color.black,0))
table.cell(table,0,4,"그리드당 투자금액 :",text_color =color.white,bgcolor=color.new(color.black,0))
//수치
table.cell(table,1,0, tostring(upperBound, '###.#####')+ "  USDT", bgcolor=color.new(#5a637e, 0),text_color =color.white)
table.cell(table,1,1, tostring(lowerBound, '###.#####')+ "  USDT", bgcolor=color.new(#5a637e, 0),text_color =color.white)
table.cell(table,1,2, tostring(i_gridQty, '###'), bgcolor=color.new(#5a637e, 0),text_color =color.white)
table.cell(table,1,3, tostring(initial_balance,'###.##')+ "  USDT", bgcolor=color.new(#5a637e, 0),text_color =color.white)
table.cell(table,1,4, tostring(initial_balance/i_gridQty,'###.##')+ "  USDT", bgcolor=color.new(#5a637e, 0),text_color =color.white)

//제목
table.cell(table,2,0,"현재 포지션 :",text_color =color.white,bgcolor=color.new(color.black,0))
table.cell(table,2,1,"현재 포지션 평단가 :",text_color =color.white,bgcolor=color.new(color.black,0))
table.cell(table,2,2,"현재 포지션 수익 :",bgcolor=color.new(color.black,0),text_color =color.white)
table.cell(table,2,3,"현재 포지션 수익 % :",bgcolor=color.new(color.black,0),text_color =color.white)
table.cell(table,2,4,"현재 포지션 수수료 :",text_color =color.white,bgcolor=color.new(color.black,0))

//수치
table.cell(table,3,0, tostring(strategy.position_size) +   syminfo.basecurrency + "\n"  + tostring(strategy.position_size*strategy.position_avg_price/1, '###.##') + "USDT" ,text_color =color.white,bgcolor=color.new(#5a637e, 0))
table.cell(table,3,1, text=strategy.position_size>0 ? tostring(strategy.position_avg_price,'###.####')+ "  USDT" : "NOT TRADING",text_color =color.white,bgcolor=color.new(#5a637e, 0))
table.cell(table,3,2, tostring(strategy.openprofit, '###.##')+ "  USDT",text_color =color.white,bgcolor=strategy.openprofit > 0 ? color.teal : color.maroon)
table.cell(table,3,3, tostring(strategy.openprofit/initial_balance*100, '###.##')+ "%",text_color =color.white,bgcolor=strategy.openprofit > 0 ? color.teal : color.maroon)
table.cell(table,3,4, "-" + tostring(strategy.position_avg_price*strategy.position_size*0.025/100,'###.##')+ "  USDT",text_color =color.white,bgcolor=color.new(#5a637e, 0))

//제목
table.cell(table,4,0,"그리드 수익 :",text_color =color.white,bgcolor=color.new(color.black,0))
table.cell(table,4,1,"그리드 수익률 :",text_color =color.white,bgcolor=color.new(color.black,0))
table.cell(table,4,2,"총 수익 :", bgcolor=color.new(color.black,0),text_color =color.white)
table.cell(table,4,3,"총 수익률 :",bgcolor=color.new(color.black,0),text_color =color.white)
table.cell(table,4,4,"현재 자산 :",bgcolor=color.new(color.black,0),text_color =color.white)


//수치
table.cell(table,5,0, tostring(strategy.netprofit, '###.#####')+ "USDT", text_color =color.white,bgcolor=strategy.netprofit > 0 ? color.teal : color.maroon)
table.cell(table,5,1, tostring((strategy.netprofit)/initial_balance*100/tradingtime, '####.##') + "%",text_color =color.white,bgcolor=strategy.netprofit > 0 ? color.teal : color.maroon)
table.cell(table,5,2, tostring(strategy.netprofit+strategy.openprofit, '###.##') + "  USDT",text_color =color.white,bgcolor=strategy.netprofit+strategy.openprofit > 0 ? color.teal : color.maroon)
table.cell(table,5,3, tostring((strategy.netprofit+strategy.openprofit)/initial_balance*100, '####.##') + "%",text_color =color.white,bgcolor=strategy.netprofit+strategy.openprofit > 0 ? color.teal : color.maroon)
table.cell(table,5,4, tostring(initial_balance+strategy.netprofit+strategy.openprofit, '###.##')+ "  USDT", text_color =color.white,bgcolor=color.new(#3d4d7c, 0))


// plot(strategy.initial_capital+ strategy.netprofit+strategy.openprofit, "총 수익 USDT",color=color.rgb(81, 137, 128))
// plot(initial_balance, "투자금액",color=color.rgb(81, 137, 128))