फ्लैग ब्रेकआउट रणनीति
अवलोकन
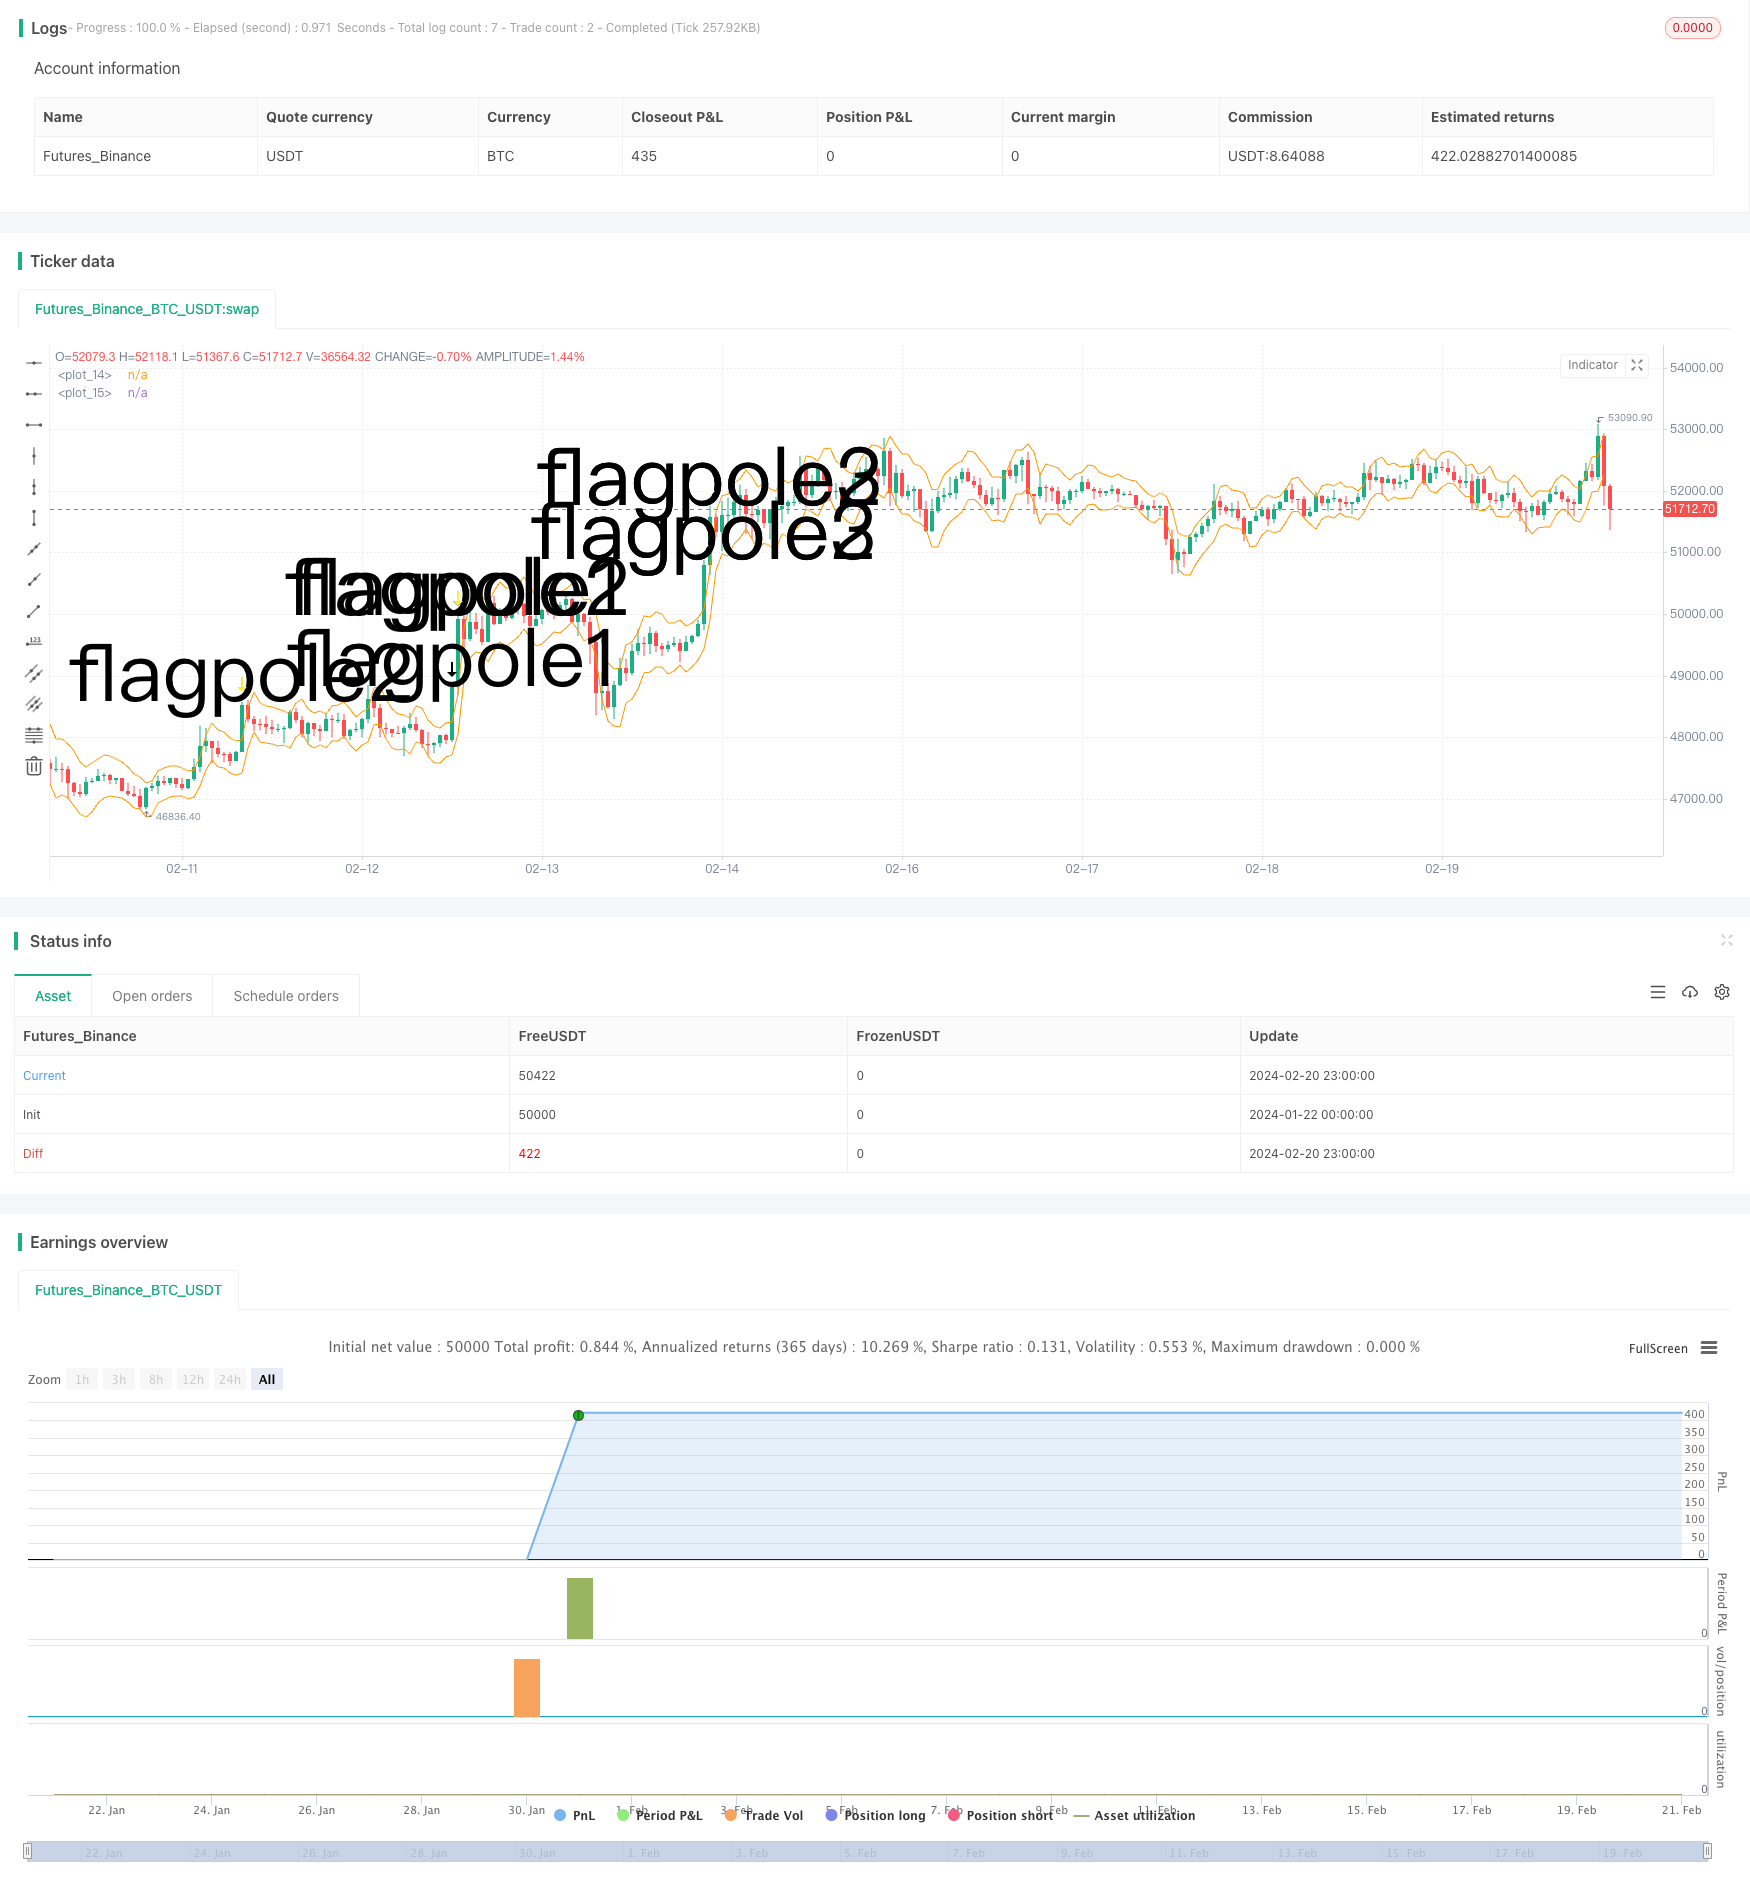
एक फ्लैग-ब्रेकिंग रणनीति एक तकनीकी विश्लेषण रणनीति है जिसका उद्देश्य फ्लैग-ग्राफ की पहचान करके और फ्लैग-ब्रेकिंग बिंदु पर प्रवेश करके प्रवृत्ति की शुरुआत को पकड़ना है। यह रणनीति औसत वास्तविक अस्थिरता रेंज (ATR) सूचकांक का उपयोग करती है, जो स्पष्ट फ्लैग-बार के बाद फ्लैग रेंज का आकलन करने के लिए सहायक निर्णय करती है, ताकि प्रवेश के अवसरों को छान लिया जा सके।
रणनीति सिद्धांत
इस रणनीति में मुख्य रूप से निम्नलिखित कदम शामिल हैंः
- मूल्य नवाचार को पूरा करने और एटीआर चैनल को तोड़ने की आवश्यकता है।
- ध्वज ऊंचाई निर्धारित करेंः ध्वज ऊंचाई को मापें।
- ध्वज की सीमा निर्धारित करेंः ध्वज का निचला बिंदु ध्वज स्तंभ की ऊंचाई का 33% है, जो ध्वज की न्यूनतम सीमा है।
- ध्वज प्रकार का निर्धारण करेंः यह निर्धारित करें कि क्या पहले 3 K लाइनें सभी ध्वज के दायरे में हैं।
- प्रवेशः झंडा दिखने पर अधिक करें।
- बाहर निकलनाः 6 के लाइनों के बाद एक निश्चित जमा
फ्लैग और फ्लैग का न्याय करते समय, रणनीति ने एटीआर सूचकांक का उपयोग करके स्पष्ट ब्रेकडाउन का न्याय करने के लिए चतुराई से उपयोग किया, और बहुत अधिक झूठे संकेतों से बचने के लिए फ्लैग की ऊंचाई को 33% के भीतर सख्ती से सीमित किया गया। इसके अलावा, 3 लगातार K लाइनों को फ्लैग बनाने का न्याय करना, उच्च विश्वसनीयता। कुल मिलाकर, रणनीति के नियम को सख्ती से डिजाइन किया गया है, और प्रवृत्ति के शुरुआती ब्रेकडाउन को पकड़ने में निश्चित रूप से एक निश्चित लाभ है।
श्रेष्ठता विश्लेषण
इस रणनीति के कुछ प्रमुख फायदे हैंः
- प्रवृत्ति का पता लगाने के लिए ध्वज संरचना का उपयोग करना तकनीकी विश्लेषण में एक क्लासिक विधि है, जिसमें सफलता की उच्च दर है।
- एटीआर संकेतकों और सख्त दायरे की सीमाओं से बहुत सारे झूठे संकेतों से बचा जा सकता है और प्रवेश की सटीकता में सुधार हो सकता है।
- फिक्स्ड 6 के लाइन आउटआउट से कुछ मुनाफे को लॉक किया जा सकता है और रुझान में बदलाव के जोखिम से बचा जा सकता है।
- नीति नियम स्पष्ट हैं, लागू करने में आसान हैं, समझने और पालन करने में आसान हैं।
- आप विभिन्न परिस्थितियों में अवसरों की तलाश कर सकते हैं, और आप अधिक लचीले हैं।
जोखिम विश्लेषण
इस रणनीति के प्रमुख जोखिमों में शामिल हैंः
- इस तरह के फ्लैग मॉडल में प्रवृत्ति का सही आकलन नहीं किया जा सकता है, और असफलताएं भी हैं।
- 6 के लाइनों में से कोई भी खेल बहुत आकस्मिक है, और वे जल्द ही बाहर निकल सकते हैं।
- जब स्थिति बहुत ज्यादा तनावपूर्ण हो जाती है, तो झूठे झंडे उभरने लगते हैं
- व्यक्तिगत नुकसान को प्रभावी ढंग से नियंत्रित करने में असमर्थ।
उपरोक्त जोखिमों के लिए, हम स्टॉप-लॉस रणनीति सेट कर सकते हैं, या आउट-ऑफ-ऑफिस तंत्र को अनुकूलित कर सकते हैं, जब लाभ एक निश्चित अनुपात तक पहुंचता है, तो हम समय पर मुनाफा कमा सकते हैं। इसके अलावा, हम अन्य संकेतकों के साथ मिलकर फ़िल्टर कर सकते हैं, ताकि बाजार में बहुत अधिक उतार-चढ़ाव होने पर झूठे संकेतों से बचा जा सके।
अनुकूलन दिशा
इस रणनीति को निम्नलिखित दिशाओं में अनुकूलित किया जा सकता हैः
- MACD, KD और अन्य संकेतक संयोजन का उपयोग करके, आघात की स्थिति में झूठे संकेतों से बचें।
- एटीआर गुणांक, खेल की अवधि आदि को बाजार श्रेणी के आधार पर मापदंडित करना, रणनीति को अधिक अनुकूलन योग्य बनाता है।
- गतिशील रूप से बाहर निकलने की तुलना में गतिशील रोक को रोकें या लाभ को वापस लेने पर विचार करें
- इस प्रकार, यह पता लगाया गया है कि क्या कोई व्यक्ति इस तरह के फ्लैग की ऊंचाई निर्धारित करने के लिए मशीन सीखने की कोशिश कर सकता है।
- वास्तविक जीत और हानि अनुपात का आकलन करें, गतिशील रूप से स्थिति आकार को समायोजित करें।
संक्षेप
कुल मिलाकर, फ्लैगशिप ब्रेकआउट रणनीति तकनीकी रूपरेखा के फैसले के रुझान का उपयोग करने के लिए शुरू होती है, एक अधिक क्लासिक तरीका है जो प्रवेश नियम डिजाइन में वास्तव में कठोर है और बहुत सारे झूठे संकेतों को फ़िल्टर कर सकता है। हालांकि, जोखिम नियंत्रण और बाहर निकलने के तंत्र में अभी भी अनुकूलन के लिए जगह है, हम रणनीति को विभिन्न बाजारों में स्थिर रूप से संचालित करने के लिए समग्र दृष्टिकोण से विचार कर सकते हैं। यदि पर्याप्त रूप से सत्यापित और अनुकूलित किया जाता है, तो यह रणनीति एक मूल्यवान घटक बन सकती है।
/*backtest
start: 2024-01-22 00:00:00
end: 2024-02-21 00:00:00
period: 1h
basePeriod: 15m
exchanges: [{"eid":"Futures_Binance","currency":"BTC_USDT"}]
*/

// © smith26
//This strategy enters on a bull flag and closes position 6 bars later.  Average true range is used instead of a moving average.
//The reason for ATR instead of MA is because with volatile securities, the flagpole must stand up a noticable "distance" above the trading range---which you can't determine with a MA alone.
//This is broken up into multiple parts: Defining a flagpole, defining the pole height, and defining the flag, which will be constrained to the top third (33%) of the pole height to be considered a flag.
//@version=4
strategy("Bull Flag v1.00", overlay=true)

ATR = atr(10) //Average True Range over last 10 bars.

upperATR = ohlc4[1] + ATR[1]  //Open + High + Low + Close divided by 4, + prior ATR.  Just used here for visually plotting the ATR upper channel.
lowerATR = ohlc4[1] - ATR[1] //Open + High + Low + Close divided by 4, - prior ATR.  Just used here for visually plotting the ATR lower channel.

//uncomment these two lines to see ATR channels
plot(upperATR, color=color.orange)
plot (lowerATR, color=color.orange)

//Current close higher than previous close, and current close minus current open is greater than 3 times the previous ATR.  "3x ATR" is chosen because any less was not a noticeable distance above the trading range.
flagpole1 = close>close[1] and (close-open) > (ATR[1] * 3)
plotshape(flagpole1, text="flagpole1", style=shape.arrowdown, size=size.huge) //Plots an arrow for flagpole1 for QA testing

//Two consecutive close higer than their previous close, and current close minus PREVIOUS open is greater than 3 times the previous ATR.
flagpole2 = close>close[1] and close[1]>close[2] and (close-open[1]) > (ATR[1] * 3)
plotshape(flagpole2, text="flagpole2", style=shape.arrowdown, size=size.huge, color=color.yellow) //Plots an arrow for flagpole2 for QA testing

//Three consecutive close higer than their previous close, and current close minus open from 2 bars ago is greater than 3 times the previous ATR.
flagpole3 = close>close[1] and close[1]>close[2] and close[2]>close[3] and (close-open[2]) > (ATR[1] * 3)
plotshape(flagpole3, text="flagpole3", style=shape.arrowdown, size=size.huge, color=color.white) //Plots an arrow for flagpole3 for QA testing

//A flagpole can be any of the three definitions of flagpole.
flagpole = flagpole1 or flagpole2 or flagpole3

//This will return the number of bars since "flagpole" was true.  Not being used, but could be useful.
//since_flagpole = barssince(flagpole)

after_pole_1 = flagpole[1] //This marks the bar directly after a flagpole.
//plotshape(after_pole_1, text="after_pole_1", style=shape.cross, size=size.large, color=color.white) //Plots a cross for after_pole_1 for QA testing
after_pole_2 = flagpole[2] //This marks the bar two bars after a flagpole.
after_pole_3 = flagpole[3] //This marks the bar three bars after a flagpole.

//This returns the price at the "top" of the flagpole (using close price) at the most recent occurence, 0.
pole_top = valuewhen(flagpole, close, 0)
//plot(pole_top, trackprice=true)  //plots a horizontal line at the most recent pole_top

//Measures the distance between last pole top and the previous SMA.
pole_height = pole_top - sma(close, 10)[1]
//plot(pole_height)

//This marks 33% below the pole_top, which will be the lowest point a flag can be.
flag_bottom = pole_top - (.33 * pole_height)
//plot(flag_bottom)

//The first, second, and third bars after the pole are considered part of a flag when open and close are between the pole_top and flag_bottom
flag1 = after_pole_1 and (open >= flag_bottom) and (open <= pole_top) and (close >= flag_bottom) and (close <= pole_top)
//plotshape(flag1, text="flag1", style=shape.flag, size=size.large, color=color.teal)
flag2 = after_pole_2 and (open >= flag_bottom) and (open <= pole_top) and (close >= flag_bottom) and (close <= pole_top)
//plotshape(flag2, text="flag2", style=shape.flag, size=size.large, color=color.teal)
flag3 = after_pole_3 and (open >= flag_bottom) and (open <= pole_top) and (close >= flag_bottom) and (close <= pole_top)
//plotshape(flag3, text="flag3", style=shape.flag, size=size.large, color=color.teal)

//When all three bars after a flagpole are a flag, the criteria are met and we have a "bull_flag"
//Specifically, when current bar is flag3, previous bar is flag2, and 2 bars ago is flag1, we have a bull_flag.
bull_flag = flag3 and flag2[1] and flag1[2]
plotshape(bull_flag, text="bull_flag", style=shape.flag, size=size.large, color=color.white) //Plots a flag for bull_flag for QA testing


if (bull_flag)
    strategy.entry("Long", strategy.long)

if barssince(bull_flag) == 6 //close 6 bars after entry.
    strategy.close("Long")