Strategi Breakout Trailing Stop V2


Tanggal Pembuatan: 2023-10-24 16:30:32 Akhirnya memodifikasi: 2023-10-24 16:30:32
menyalin: 0 Jumlah klik: 1615
1
fokus pada
1617
Pengikut

Strategi Breakout Trailing Stop V2

Ringkasan

Strategi ini menggabungkan keunggulan dari strategi breakout dan strategi trend tracking stop loss untuk menangkap sinyal breakout resistance support dalam grafik garis panjang, dan menggunakan moving average untuk melakukan stop loss tracking, untuk menghasilkan keuntungan di arah tren garis panjang, dan untuk mengendalikan risiko.

Prinsip Strategi

  1. Strategi pertama menghitung moving average dari beberapa kelompok parameter yang berbeda, yang digunakan sebagai penilaian tren, dukungan resistensi, dan pelacakan stop loss.

  2. Kemudian mencari titik tertinggi dan terendah dalam periode yang ditentukan sebagai area resistensi dukungan untuk masuk. Ketika harga menembus resistensi dukungan ini, sinyal dihasilkan.

  3. Strategi untuk melakukan pembelian dengan melakukan sinyal multipel pada titik tertinggi untuk melakukan penembusan, dan menjual pada titik terendah untuk melakukan sinyal shorting.

  4. Setelah masuk, posisi akan dipegang dengan titik terendah dari titik terendah yang dirobek sebagai titik stop loss.

  5. Ketika posisi masuk ke posisi yang menguntungkan, stop loss akan beralih ke tracking moving average. Ketika harga turun di bawah moving average, stop loss akan ditetapkan sebagai titik terendah dari garis K akar tersebut.

  6. Dengan begitu, Anda dapat mengunci keuntungan, dan tetap memiliki ruang yang cukup untuk mengikuti tren.

  7. Strategi ini juga menambahkan rata-rata fluktuasi nyata untuk memastikan bahwa hanya ada perpanjangan yang tepat untuk melakukan breakout dan menghindari ekspansinya yang berlebihan.

Analisis Keunggulan Strategi

  1. Keuntungan ganda dari strategi breakthrough dan strategi stop loss.

  2. Dengan cara ini, Anda dapat membeli breakout berdasarkan tren garis panjang dan meningkatkan probabilitas keuntungan.

  3. Strategi stop loss melindungi posisi dan memberikan posisi ruang yang cukup untuk beroperasi.

  4. Menambahkan filter fluktuasi untuk menghindari terobosan yang tidak menguntungkan.

  5. Otomatisasi transaksi, cocok untuk part time invoice.

  6. Dapat disesuaikan dengan rata-rata periode yang berbeda.

  7. Fleksibel dalam penyesuaian Stop Loss Tracking

Analisis Risiko Strategi

  1. Strategi penembusan rentan terhadap risiko penembusan palsu.

  2. Perlu cukup fluktuasi untuk menghasilkan sinyal terobosan, yang mudah tidak efektif dalam situasi yang berbalik.

  3. Beberapa terobosan mungkin terlalu singkat untuk ditangkap. Anda dapat menurunkan timeline untuk mencari lebih banyak peluang.

  4. Tracking stop loss mungkin terlalu sering terhenti dalam situasi getaran. Anda dapat melepaskan jarak stop loss dengan tepat.

  5. Filter fluktuasi mungkin melewatkan beberapa kesempatan. Parameter filter dapat dikurangi.

Arah optimasi strategi

  1. Uji kombinasi parameter rata-rata yang berbeda untuk menemukan parameter optimal.

  2. Uji coba berbagai mekanisme penembusan, seperti saluran, K-line, dan lain-lain.

  3. Cobalah berbagai cara untuk mencari stop loss yang optimal.

  4. Strategi pengelolaan dana yang dioptimalkan, seperti skor positio.

  5. Menambahkan filter indikator teknis statistik untuk meningkatkan akurasi filter.

  6. Ini adalah salah satu strategi yang paling populer di Indonesia.

  7. Menambahkan algoritma pembelajaran mesin untuk meningkatkan efektivitas strategi.

Meringkaskan

Strategi ini mengintegrasikan breakthrough thinking dan trend tracking stop loss thinking, dengan asumsi bahwa penilaian garis panjang yang benar, dapat mengoptimalkan ruang keuntungan. Kuncinya adalah menemukan kombinasi parameter yang optimal, dan bekerja sama dengan strategi manajemen dana yang baik, untuk menangkap peluang garis panjang sekaligus mewujudkan risiko yang dapat dikendalikan. Strategi ini diharapkan menjadi strategi tren garis panjang yang lebih andal dengan pengoptimalan lebih lanjut.
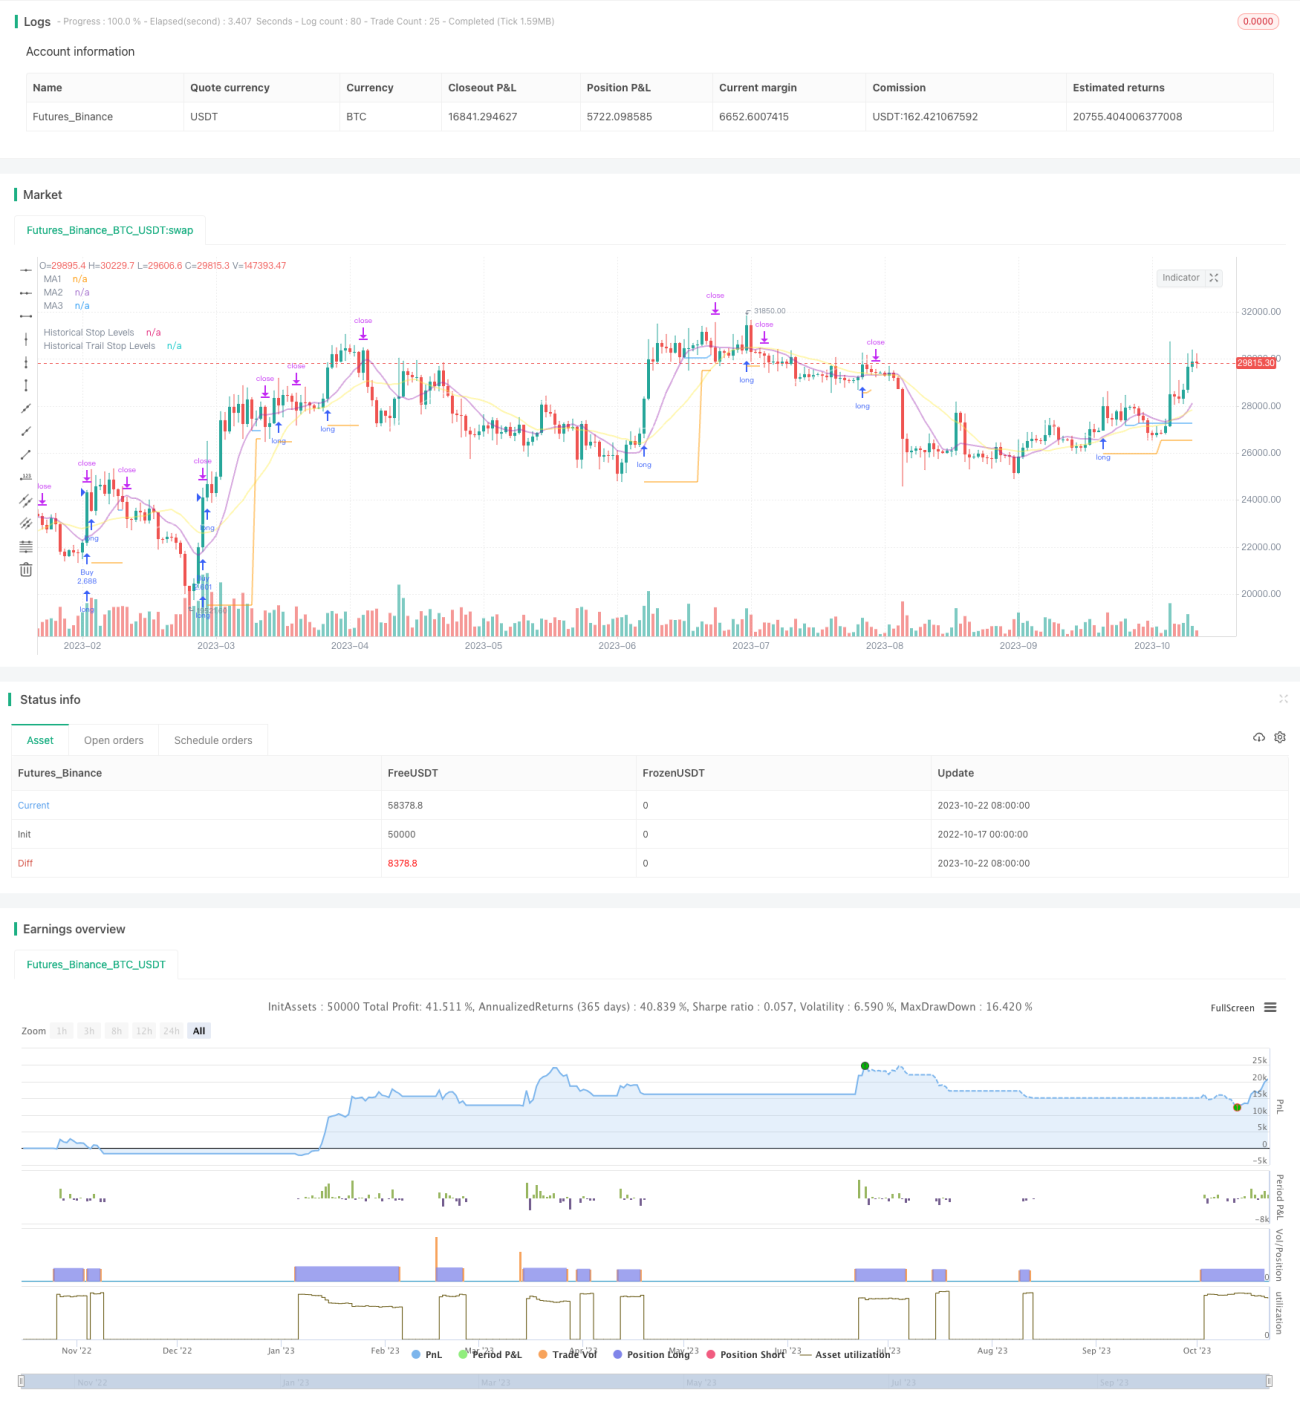
Kode Sumber Strategi
/*backtest
start: 2022-10-17 00:00:00
end: 2023-10-23 00:00:00
period: 1d
basePeriod: 1h
exchanges: [{"eid":"Futures_Binance","currency":"BTC_USDT"}]
*/

// This source code is subject to the terms of the Mozilla Public License 2.0 at https://mozilla.org/MPL/2.0/
// © millerrh

// The intent of this strategy is to buy breakouts with a tight stop on smaller timeframes in the direction of the longer term trend.
// Then use a trailing stop of a close below either the 10 MA or 20 MA (user choice) on that larger timeframe as the position 
// moves in your favor (i.e. whenever position price rises above the MA).
// Option of using daily ADR as a measure of finding contracting ranges and ensuring a decent risk/reward.
// (If the difference between the breakout point and your stop level is below a certain % of ATR, it could possibly find those consolidating periods.)
// V2 - updates code of original Qullamaggie Breakout to optimize and debug it a bit - the goal is to remove some of the whipsaw and poor win rate of the 
// original by incorporating some of what I learned in the Breakout Trend Follower script.

//@version=4
strategy("Qullamaggie Breakout V2", overlay=true, initial_capital=100000, currency='USD', calc_on_every_tick = true,
   default_qty_type=strategy.percent_of_equity, default_qty_value=100, commission_type=strategy.commission.percent, commission_value=0.1)
   
// === BACKTEST RANGE ===
Start = input(defval = timestamp("01 Jan 2019 06:00 +0000"), title = "Backtest Start Date", type = input.time, group = "backtest window and pivot history")
Finish = input(defval = timestamp("01 Jan 2100 00:00 +0000"), title = "Backtest End Date", type = input.time, group = "backtest window and pivot history")

// Inputs
showPivotPoints = input(title = "Show Historical Pivot Points?", type = input.bool, defval = false, group = "backtest window and pivot history",
  tooltip = "Toggle this on to see the historical pivot points that were used.  Change the Lookback Periods to adjust the frequency of these points.")
htf = input(defval="D", title="Timeframe of Moving Averages", type=input.resolution, group = "moving averages",
  tooltip = "Allows you to set a different time frame for the moving averages and your trailing stop.
  The default behavior is to identify good tightening setups on a larger timeframe
  (like daily) and enter the trade on a breakout occuring on a smaller timeframe, using the moving averages of the larger timeframe to trail your stop.")
maType = input(defval="SMA", options=["EMA", "SMA"], title = "Moving Average Type", group = "moving averages")
ma1Length = input(defval = 10, title = "1st Moving Average Length", minval = 1, group = "moving averages")
ma2Length = input(defval = 20, title = "2nd Moving Average Length", minval = 1, group = "moving averages")
ma3Length = input(defval = 50, title = "3rd Moving Average Length", minval = 1, group = "moving averages")
useMaFilter = input(title = "Use 3rd Moving Average for Filtering?", type = input.bool, defval = true, group = "moving averages",
  tooltip = "Signals will be ignored when price is under this slowest moving average.  The intent is to keep you out of bear periods and only
             buying when price is showing strength or trading with the longer term trend.")
trailMaInput = input(defval="1st Moving Average", options=["1st Moving Average", "2nd Moving Average"], title = "Trailing Stop", group = "stops",
  tooltip = "Initial stops after entry follow the range lows.  Once in profit, the trade gets more wiggle room and
  stops will be trailed when price breaches this moving average.")
trailMaTF = input(defval="Same as Moving Averages", options=["Same as Moving Averages", "Same as Chart"], title = "Trailing Stop Timeframe", group = "stops",
  tooltip = "Once price breaches the trail stop moving average, the stop will be raised to the low of that candle that breached. You can choose to use the
  chart timeframe's candles breaching or use the same timeframe the moving averages use. (i.e. if daily, you wait for the daily bar to close before setting
  your new stop level.)")
currentColorS = input(color.new(color.orange,50), title = "Current Range S/R Colors:    Support", type = input.color, group = "stops", inline = "lineColor")
currentColorR = input(color.new(color.blue,50), title = " Resistance", type = input.color, group = "stops", inline = "lineColor")

// Pivot lookback
lbHigh = 3
lbLow = 3

// MA Calculations (can likely move this to a tuple for a single security call!!)
ma(maType, src, length) =>
    maType == "EMA" ? ema(src, length) : sma(src, length) //Ternary Operator (if maType equals EMA, then do ema calc, else do sma calc)
ma1 = security(syminfo.tickerid, htf, ma(maType, close, ma1Length))
ma2 = security(syminfo.tickerid, htf, ma(maType, close, ma2Length))
ma3 = security(syminfo.tickerid, htf, ma(maType, close, ma3Length))

plot(ma1, color=color.new(color.purple, 60), style=plot.style_line, title="MA1", linewidth=2)
plot(ma2, color=color.new(color.yellow, 60), style=plot.style_line, title="MA2", linewidth=2)
plot(ma3, color=color.new(color.white, 60), style=plot.style_line, title="MA3", linewidth=2)

// === USE ADR FOR FILTERING ===
// The idea here is that you want to buy in a consolodating range for best risk/reward. So here you can compare the current distance between 
// support/resistance vs. the ADR and make sure you aren't buying at a point that is too extended.
useAdrFilter = input(title = "Use ADR for Filtering?", type = input.bool, defval = false, group = "adr filtering",
  tooltip = "Signals will be ignored if the distance between support and resistance is larger than a user-defined percentage of ADR (or monthly volatility
  in the stock screener). This allows the user to ensure they are not buying something that is too extended and instead focus on names that are consolidating more.")
adrPerc = input(defval = 120, title = "% of ADR Value", minval = 1, group = "adr filtering")
tableLocation = input(defval="Bottom", options=["Top", "Bottom"], title = "ADR Table Visibility", group = "adr filtering",
  tooltip = "Place ADR table on the top of the pane, the bottom of the pane, or off.")
adrValue = security(syminfo.tickerid, "D", sma((high-low)/abs(low) * 100, 21)) // Monthly Volatility in Stock Screener (also ADR)
adrCompare = (adrPerc * adrValue) / 100

// === PLOT SWING HIGH/LOW AND MOST RECENT LOW TO USE AS STOP LOSS EXIT POINT ===
ph = pivothigh(high, lbHigh, lbHigh)
pl = pivotlow(low, lbLow, lbLow)
highLevel = valuewhen(ph, high[lbHigh], 0)
lowLevel = valuewhen(pl, low[lbLow], 0)
barsSinceHigh = barssince(ph) + lbHigh
barsSinceLow = barssince(pl) + lbLow
timeSinceHigh = time[barsSinceHigh]
timeSinceLow = time[barsSinceLow]

//Removes color when there is a change to ensure only the levels are shown (i.e. no diagonal lines connecting the levels)
pvthis = fixnan(ph)
pvtlos = fixnan(pl)
hipc = change(pvthis) != 0 ? na : color.new(color.maroon, 0)
lopc = change(pvtlos) != 0 ? na : color.new(color.green, 0)

// Display Pivot lines
plot(showPivotPoints ? pvthis : na, color=hipc, linewidth=1, offset=-lbHigh, title="Top Levels")
plot(showPivotPoints ? pvthis : na, color=hipc, linewidth=1, offset=0, title="Top Levels 2")
plot(showPivotPoints ? pvtlos : na, color=lopc, linewidth=1, offset=-lbLow, title="Bottom Levels")
plot(showPivotPoints ? pvtlos : na, color=lopc, linewidth=1, offset=0, title="Bottom Levels 2")

// BUY AND SELL CONDITIONS
buyLevel = valuewhen(ph, high[lbHigh], 0) //Buy level at Swing High

// Conditions for entry
stopLevel = float(na) // Define stop level here as "na" so that I can reference it in the ADR calculation before the stopLevel is actually defined.
buyConditions = (useMaFilter ? buyLevel > ma3 : true) and
  (useAdrFilter ? (buyLevel - stopLevel[1]) < adrCompare : true) 
buySignal = crossover(high, buyLevel) and buyConditions

// Trailing stop points - when price punctures the moving average, move stop to the low of that candle - Define as function/tuple to only use one security call
trailMa = trailMaInput == "1st Moving Average" ? ma1 : ma2
f_getCross() =>
    maCrossEvent = crossunder(low, trailMa)
    maCross = valuewhen(maCrossEvent, low, 0)
    maCrossLevel = fixnan(maCross)
    maCrossPc = change(maCrossLevel) != 0 ? na : color.new(color.blue, 0) //Removes color when there is a change to ensure only the levels are shown (i.e. no diagonal lines connecting the levels)
    [maCrossEvent, maCross, maCrossLevel, maCrossPc]
crossTF = trailMaTF == "Same as Moving Averages" ? htf : ""
[maCrossEvent, maCross, maCrossLevel, maCrossPc] = security(syminfo.tickerid, crossTF, f_getCross())

plot(showPivotPoints ? maCrossLevel : na, color = maCrossPc, linewidth=1, offset=0, title="Ma Stop Levels")

// == STOP AND PRICE LEVELS ==
inPosition = strategy.position_size > 0
buyLevel := inPosition ? buyLevel[1] : buyLevel
stopDefine = valuewhen(pl, low[lbLow], 0) //Stop Level at Swing Low
inProfit = strategy.position_avg_price <= stopDefine[1]
// stopLevel := inPosition ? stopLevel[1] : stopDefine // Set stop loss based on swing low and leave it there
stopLevel := inPosition and not inProfit ? stopDefine : inPosition and inProfit ? stopLevel[1] : stopDefine // Trail stop loss until in profit
trailStopLevel = float(na)

// trying to figure out a better way for waiting on the trail stop - it can trigger if above the stopLevel even if the MA hadn't been breached since opening the trade
notInPosition = strategy.position_size == 0
inPositionBars = barssince(notInPosition)
maCrossBars = barssince(maCrossEvent)
trailCross = inPositionBars > maCrossBars
// trailCross = trailMa > stopLevel
trailStopLevel := inPosition and trailCross ? maCrossLevel : na

plot(inPosition ? stopLevel : na, style=plot.style_linebr, color=color.new(color.orange, 50), linewidth = 2, title = "Historical Stop Levels", trackprice=false)
plot(inPosition ? trailStopLevel : na, style=plot.style_linebr, color=color.new(color.blue, 50), linewidth = 2, title = "Historical Trail Stop Levels", trackprice=false)

// == PLOT SUPPORT/RESISTANCE LINES FOR CURRENT CHART TIMEFRAME ==
// Use a function to define the lines
// f_line(x1, y1, y2, _color) =>
//     var line id = na
//     line.delete(id)
//     id := line.new(x1, y1, time, y2, xloc.bar_time, extend.right, _color)

// highLine = f_line(timeSinceHigh, highLevel, highLevel, currentColorR)
// lowLine = f_line(timeSinceLow, lowLevel, lowLevel, currentColorS)


// == ADR TABLE ==
tablePos = tableLocation == "Top" ? position.top_right : position.bottom_right
var table adrTable = table.new(tablePos, 2, 1, border_width = 3)
lightTransp = 90
avgTransp   = 80
heavyTransp = 70
posColor = color.rgb(38, 166, 154)
negColor = color.rgb(240, 83, 80)
volColor = color.new(#999999, 0)

f_fillCellVol(_table, _column, _row, _value) =>
    _transp = abs(_value) > 7 ? heavyTransp : abs(_value) > 4 ? avgTransp : lightTransp
    _cellText = tostring(_value, "0.00") + "%\n" + "ADR"
    table.cell(_table, _column, _row, _cellText, bgcolor = color.new(volColor, _transp), text_color = volColor, width = 6)

srDistance = (highLevel - lowLevel)/highLevel * 100

f_fillCellCalc(_table, _column, _row, _value) =>
    _c_color = _value >= adrCompare ? negColor : posColor
    _transp = _value >= adrCompare*0.8 and _value <= adrCompare*1.2 ? lightTransp : 
      _value >= adrCompare*0.5 and _value < adrCompare*0.8 ? avgTransp :
      _value < adrCompare*0.5 ? heavyTransp :
      _value > adrCompare*1.2 and _value <= adrCompare*1.5 ? avgTransp :
      _value > adrCompare*1.5 ? heavyTransp : na
    _cellText = tostring(_value, "0.00") + "%\n" + "Range"
    table.cell(_table, _column, _row, _cellText, bgcolor = color.new(_c_color, _transp), text_color = _c_color, width = 6)

if barstate.islast
    f_fillCellVol(adrTable, 0, 0, adrValue)
    f_fillCellCalc(adrTable, 1, 0, srDistance)
    // f_fillCellVol(adrTable, 0, 0, inPositionBars)
    // f_fillCellCalc(adrTable, 1, 0, maCrossBars)

// == STRATEGY ENTRY AND EXIT ==
strategy.entry("Buy", strategy.long, stop = buyLevel, when = buyConditions)

stop = stopLevel > trailStopLevel ? stopLevel : close[1] > trailStopLevel and close[1] > trailMa ? trailStopLevel : stopLevel
strategy.exit("Sell", from_entry = "Buy", stop=stop)