Strategi Perdagangan Garis

Ringkasan
Strategi ini didasarkan pada gagasan untuk menembus support dan resistance yang penting, dengan mengidentifikasi garis tren naik dan garis tren turun yang penting dalam grafik harga, dan melakukan perdagangan ketika harga menembus garis tren. Strategi ini sederhana dan dapat diandalkan, dan cocok untuk lingkungan pasar dengan tren yang jelas.
Prinsip Strategi
Strategi ini mengidentifikasi titik-titik penting di mana harga naik dan turun, dengan menghitung titik-titik tinggi dan rendah pada garis-garis pilar di sebelah kiri dan kanan, untuk mendapatkan garis-garis dukungan dan tekanan.
-
menggunakan
pivothigh()Danpivotlow()Fungsi mendeteksi titik tinggi dan titik rendah yang penting. -
Persamaan garis dukungan dan garis tekanan berdasarkan titik tinggi dan rendah.
-
Ketika harga melewati garis tekanan, lakukan lebih banyak; ketika harga melewati garis dukungan, lakukan lebih sedikit.
-
Anda bisa memilih untuk melakukan lebih banyak atau lebih sedikit sesuai dengan arah tren.
-
Anda dapat memilih apakah akan melakukan pivot langsung pada saat breakout.
-
Anda dapat memilih untuk menggunakan Stop Loss, Stop Stop, dan Stop Loss.
-
Anda dapat memilih Stop Swing, Stop ATR, dan Stop Fixed.
Strategi ini digunakan untuk melakukan trading dengan cara yang sederhana, yaitu dengan menggunakan trend clues, trend tracking, dan trend reversal.
Analisis Keunggulan
- Strategi ini sederhana, mudah dipahami dan diterapkan.
- Dengan menggunakan Breakthrough Theory, ada beberapa keuntungan probabilitas.
- Anda dapat mengatur Stop Loss Stop Stop dan mengontrol risiko.
- Trend tracking atau trend reversal dapat dilakukan.
- Parameter yang dapat dioptimalkan untuk lingkungan pasar yang berbeda.
Analisis risiko
- Ada kemungkinan sinyal penembusan salah.
- Setting Stop Loss yang tidak tepat dapat meningkatkan kerugian.
- Operasi pembalikan beresiko tersandung.
- Parameter tuning membutuhkan pengalaman, pengaturan yang tidak tepat dapat gagal.
- "Breakthrough" murni, tidak berlaku untuk kondisi gempa.
Risiko dapat dikurangi dengan mengoptimalkan strategi stop loss, mengevaluasi kualitas sinyal penembusan, dan mengevaluasi waktu pembalikan.
Arah optimasi
- Evaluasi keandalan sinyal penembusan untuk meningkatkan akurasi.
- Tergabung dengan volume, memperkuat sinyal penembusan.
- Optimalkan strategi stop loss untuk beradaptasi dengan perubahan pasar.
- Evaluasi waktu terbaik untuk membalikkan sikap.
- parameter tuning。
- Evaluasi model multi-faktor
- Evaluasi digunakan dalam kombinasi dengan indikator lainnya.
Meringkaskan
Strategi ini secara keseluruhan sederhana dan praktis, untuk menangkap tren harga melalui tren yang sederhana, risiko yang dapat dikendalikan. Strategi ini dapat dioptimalkan melalui banyak aspek, untuk lebih banyak situasi pasar, secara keseluruhan merupakan strategi pelacakan tren yang sangat praktis.
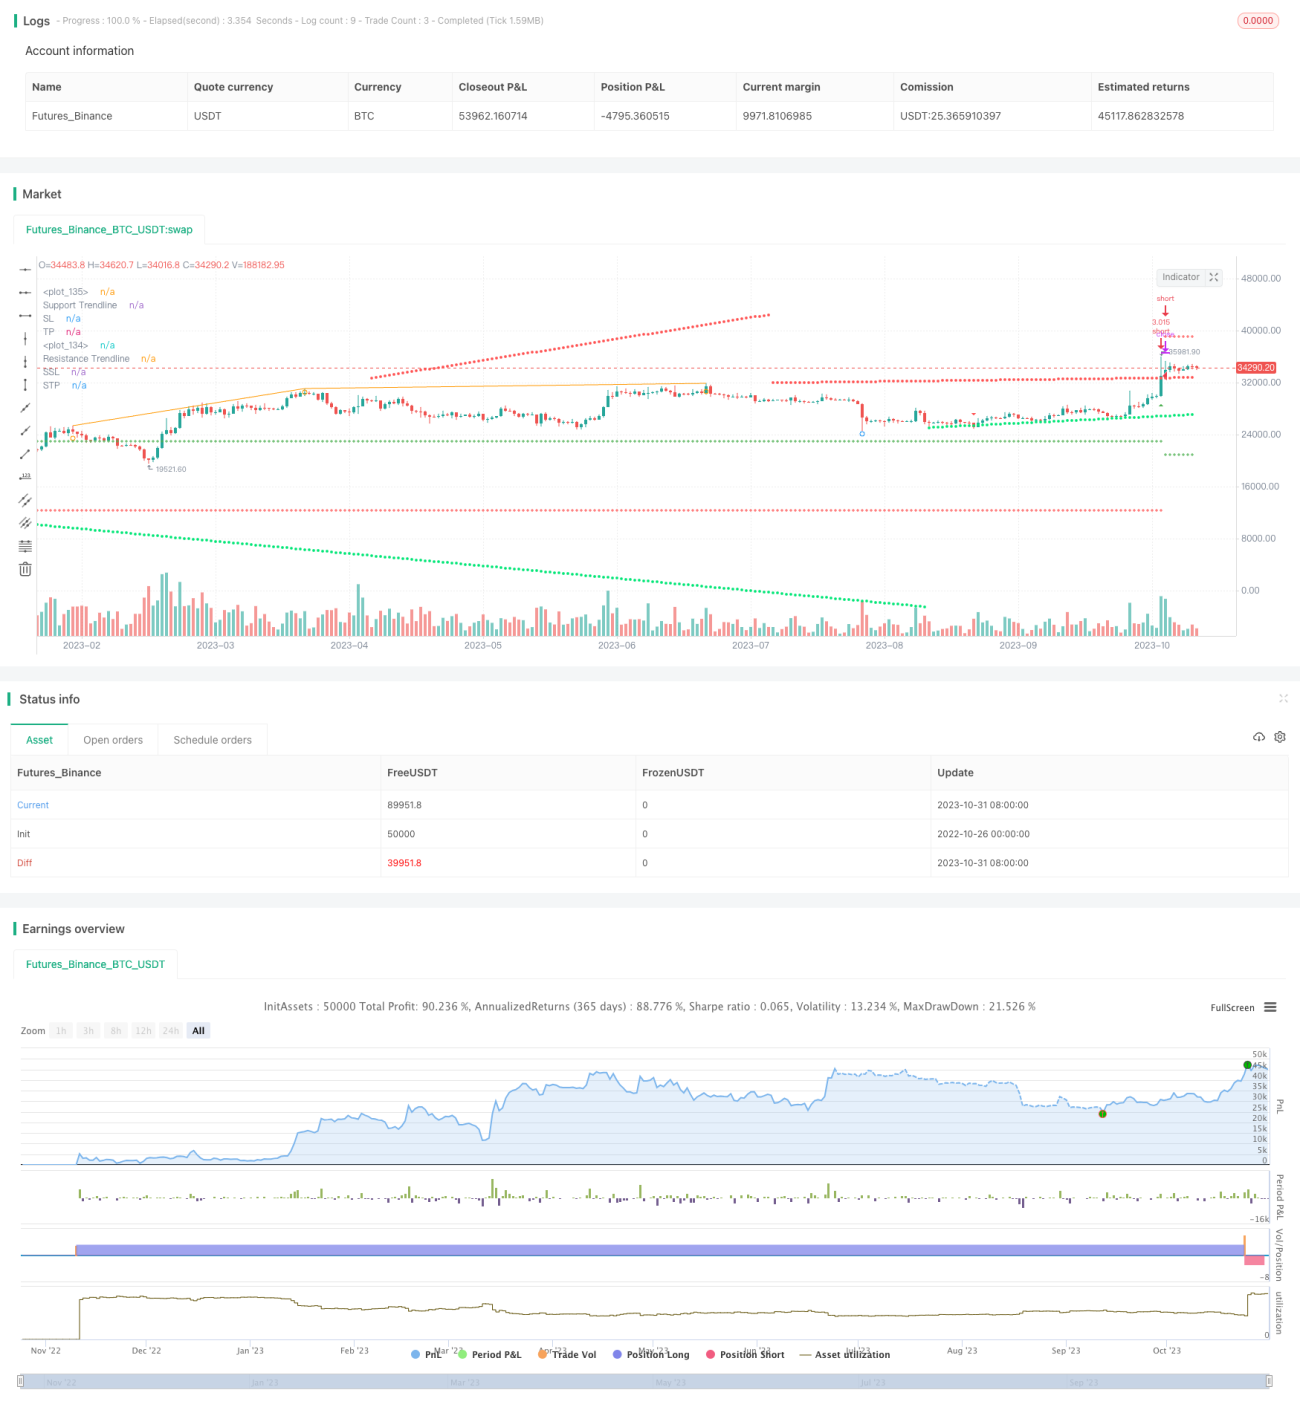
/*backtest
start: 2022-10-26 00:00:00
end: 2023-11-01 00:00:00
period: 1d
basePeriod: 1h
exchanges: [{"eid":"Futures_Binance","currency":"BTC_USDT"}]
*/

// This source code is subject to the terms of the Mozilla Public License 2.0 at https://mozilla.org/MPL/2.0/
// © tweakerID and © BacktestRookies

// Using the clever calculations and code by BacktestRookies, here is a strategy that buys - 1