Strategi Perdagangan Jangka Pendek Mengikuti Tren

Ringkasan
Strategi ini adalah strategi perdagangan garis pendek yang didasarkan pada beberapa indikator untuk menilai tren. Strategi ini secara komprehensif menggunakan delapan indikator termasuk WOW, BMA, BarColor, SuperTrend, DI, TTS, RSI, dan WTO untuk menilai arah tren dan dengan demikian membuat keputusan membeli dan menjual.
Prinsip Strategi
Strategi ini pertama-tama menghitung dan menilai arah tren dari delapan indikator WOW, BMA, BarColor, SuperTrend, DI, TTS, RSI, dan WTO.
Indikator WOW menilai tren bullish berdasarkan posisi entitas dalam harga. Jika posisi entitas mendekati lintasan atas, itu adalah bullish; Jika mendekati lintasan bawah, itu adalah bearish.
Indikator BMA menilai tren berdasarkan hubungan overbought SMA, jika harga close out di SMA, harga open out di SMA adalah bullish, dan turun di bawahnya adalah bearish.
Indikator BarColor menilai tren berdasarkan warna garis K, dengan beberapa garis lurus berturut-turut menjadi bullish dan garis negatif berturut-turut menjadi bearish.
Indikator SuperTrend menilai tren harga berdasarkan rentang fluktuasi rata-rata, dengan harga di atas rel bullish dan di bawah rel bearish.
Indikator DI menilai tren berdasarkan rasio besar dan kecil dari dinamika overhead, dinamika overhead lebih besar dari dinamika overhead adalah bullish, sebaliknya adalah bearish.
Indikator TTS menilai tren bullish berdasarkan hubungan posisi harga dengan garis rata-rata.
Indikator RSI menilai arah tren berdasarkan posisi indikator yang relatif kuat.
Indikator WTO menilai arah tren berdasarkan banyaknya indikator volatilitas.
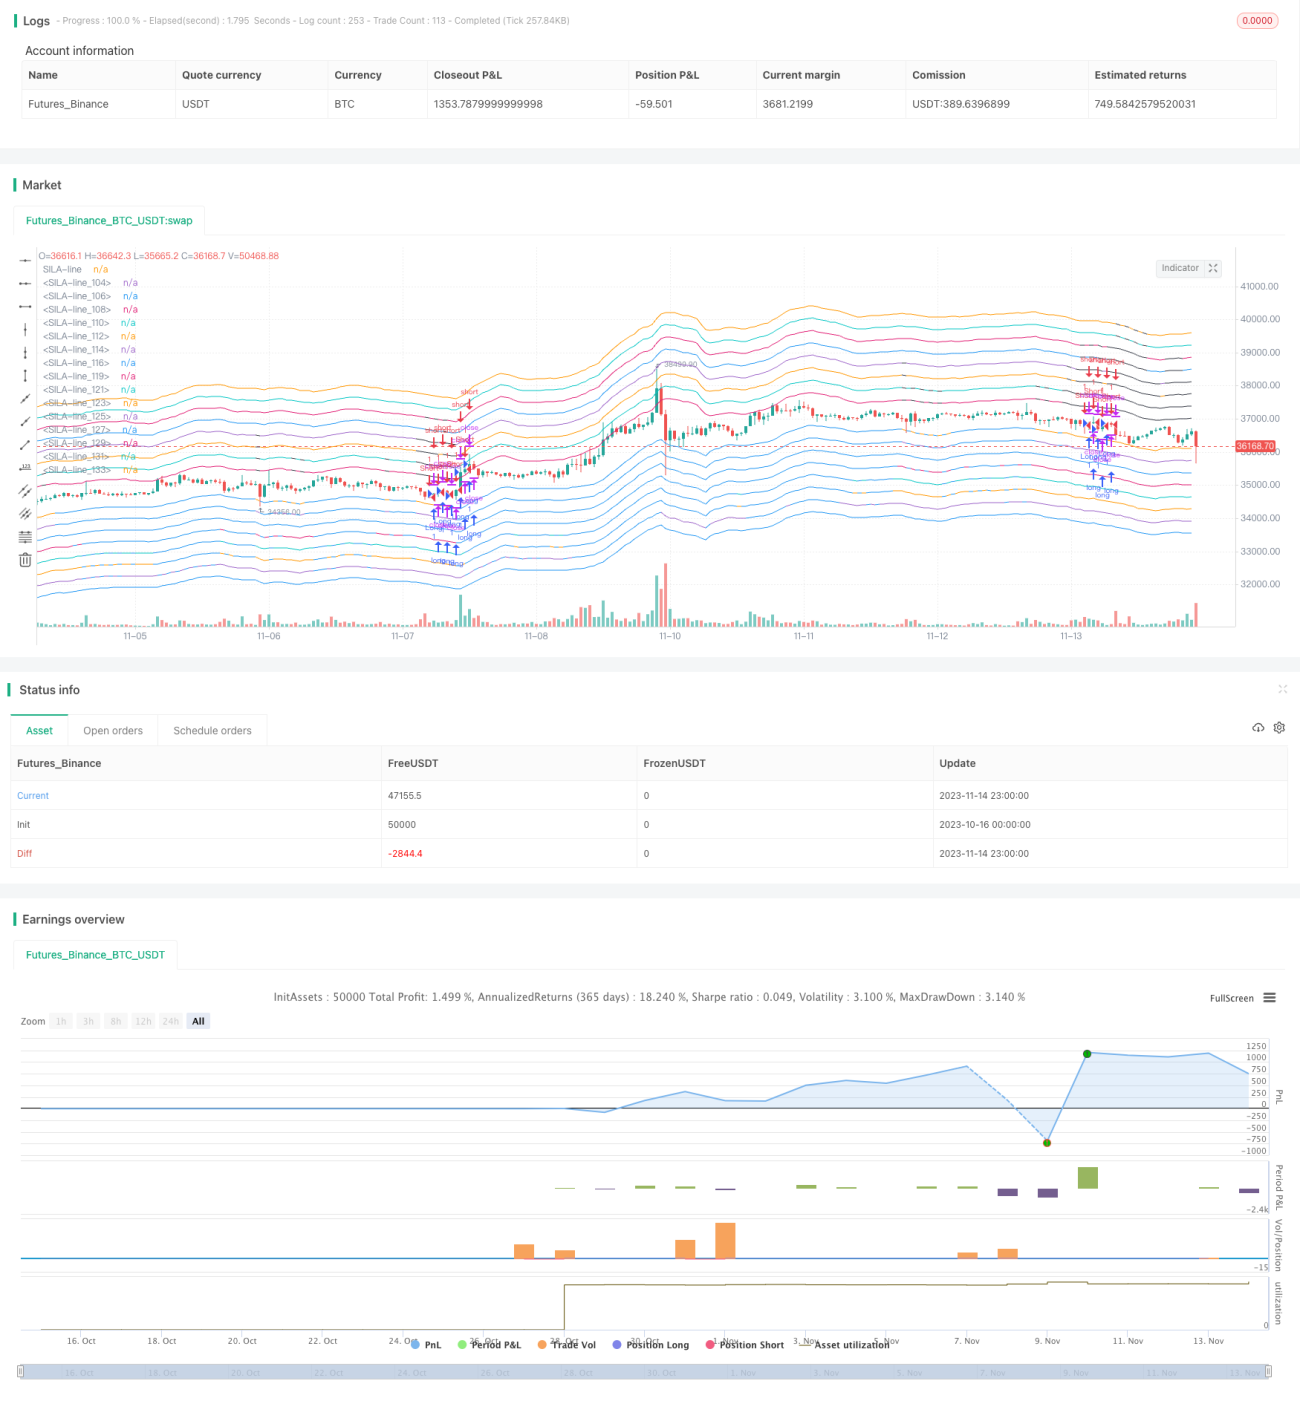
Strategi ini kemudian menghitung jumlah bullish dari 8 indikator tersebut dan dengan demikian memetakan SILA bullish support line dan resistance line. Semakin banyak jumlah support line dan resistance line, semakin kuat sinyal tren.
Ketika beberapa indikator bullish, sinyal beli dihasilkan jika harga close out berada di atas garis support level terendah; ketika beberapa indikator bearish, sinyal jual dihasilkan jika harga close out berada di bawah garis resistance level terendah.
Selain itu, strategi ini juga akan menggunakan bentuk garis K untuk menilai peluang untuk retracement jangka pendek, mencari titik masuk yang lebih menguntungkan ketika tren berbalik.
Keunggulan Strategis
- Mengintegrasikan berbagai indikator untuk menilai tren dan meningkatkan akurasi penilaian
Strategi ini tidak bergantung pada satu indikator, tetapi menggunakan 8 indikator penilaian tren yang umum digunakan secara terpadu, untuk menilai tren secara multi-dimensi, yang dapat meningkatkan akurasi dan keandalan penilaian.
- Sistem SILA memetakan resistensi dukungan bertingkat, mengidentifikasi sinyal tren yang kuat
Strategi ini didasarkan pada sinyal bullish-bullish dari beberapa indikator, dengan menggunakan sistem SILA untuk memetakan beberapa tingkatan garis dukungan dan garis perlawanan. Semakin banyak garis menunjukkan semakin kuat sinyal tren. Ini dapat membantu pedagang untuk lebih mengidentifikasi kekuatan sinyal.
- Kombinasi K-Line dengan K-Line untuk mencari kesempatan untuk kembali, dan masuk lebih baik.
Strategi ini tidak hanya didasarkan pada arah indikator tren, tetapi juga menggabungkan bentuk garis K untuk mencari kesempatan untuk membalikkan dalam waktu singkat, dan masuk ke titik terbalik tren untuk mendapatkan tempat yang lebih baik di titik masuk.
Risiko Strategis
- Mungkin ada perbedaan antara beberapa indikator
Strategi ini menggunakan beberapa indikator, di antara indikator-indikator ini mungkin terjadi perbedaan penilaian dalam beberapa kasus, yang memerlukan pedagang sendiri untuk melakukan pertimbangan, meningkatkan kesulitan dalam pengambilan keputusan.
- Pengaturan parameter indikator mungkin perlu dioptimalkan
Banyak indikator dalam strategi ini menggunakan parameter default, dan mungkin perlu mengoptimalkan parameter untuk mendapatkan hasil terbaik.
- Risiko sistemik yang perlu dipertimbangkan
Jika terjadi peristiwa Black Swan yang signifikan, risiko sistemik dapat menyebabkan indikator teknis normal tidak berfungsi, dan perlu diperhatikan untuk menilai risiko sistemik pasar.
- Risiko penarikan diri
Penarikan perdagangan yang mengikuti tren mungkin lebih besar pada tahap ekspansi, perlu berhati-hati untuk mengendalikan skala transaksi tunggal untuk membatasi penarikan.
Arah optimasi strategi
- Optimasi tes parameter indikator
Dengan metode yang lebih sistematis, parameter dari setiap indikator seperti panjang siklus, ukuran angka, dan lain-lain dapat dioptimalkan untuk mencari kombinasi parameter yang optimal.
- Meningkatkan Stop Loss
Anda dapat mempertimbangkan untuk menambahkan stop loss bergerak atau stop loss persentase untuk mengendalikan penarikan.
- Indikator Kekuatan Kombinasi
Indikator kuantitatif seperti MAVP, OBV dan indikator tren dapat dikombinasikan untuk meningkatkan akurasi keputusan taktik.
- Mengoptimalkan manajemen posisi
Rasio kepemilikan di berbagai tahap pasar dapat dipelajari untuk meningkatkan posisi ketika tren lebih jelas.
Meringkaskan
Strategi Overall adalah strategi perdagangan garis pendek yang melacak tren multi-indikator. Strategi ini mengintegrasikan penggunaan beberapa indikator untuk menentukan arah tren, menggunakan sistem SILA untuk mengidentifikasi kekuatan sinyal, dan dibantu dengan pengoptimalan masuk dengan bentuk K. Strategi ini dapat meningkatkan akurasi penilaian, tetapi perlu diperhatikan risiko perbedaan antara indikator yang berbeda.
- 1