Strategi multi-tren

Ringkasan
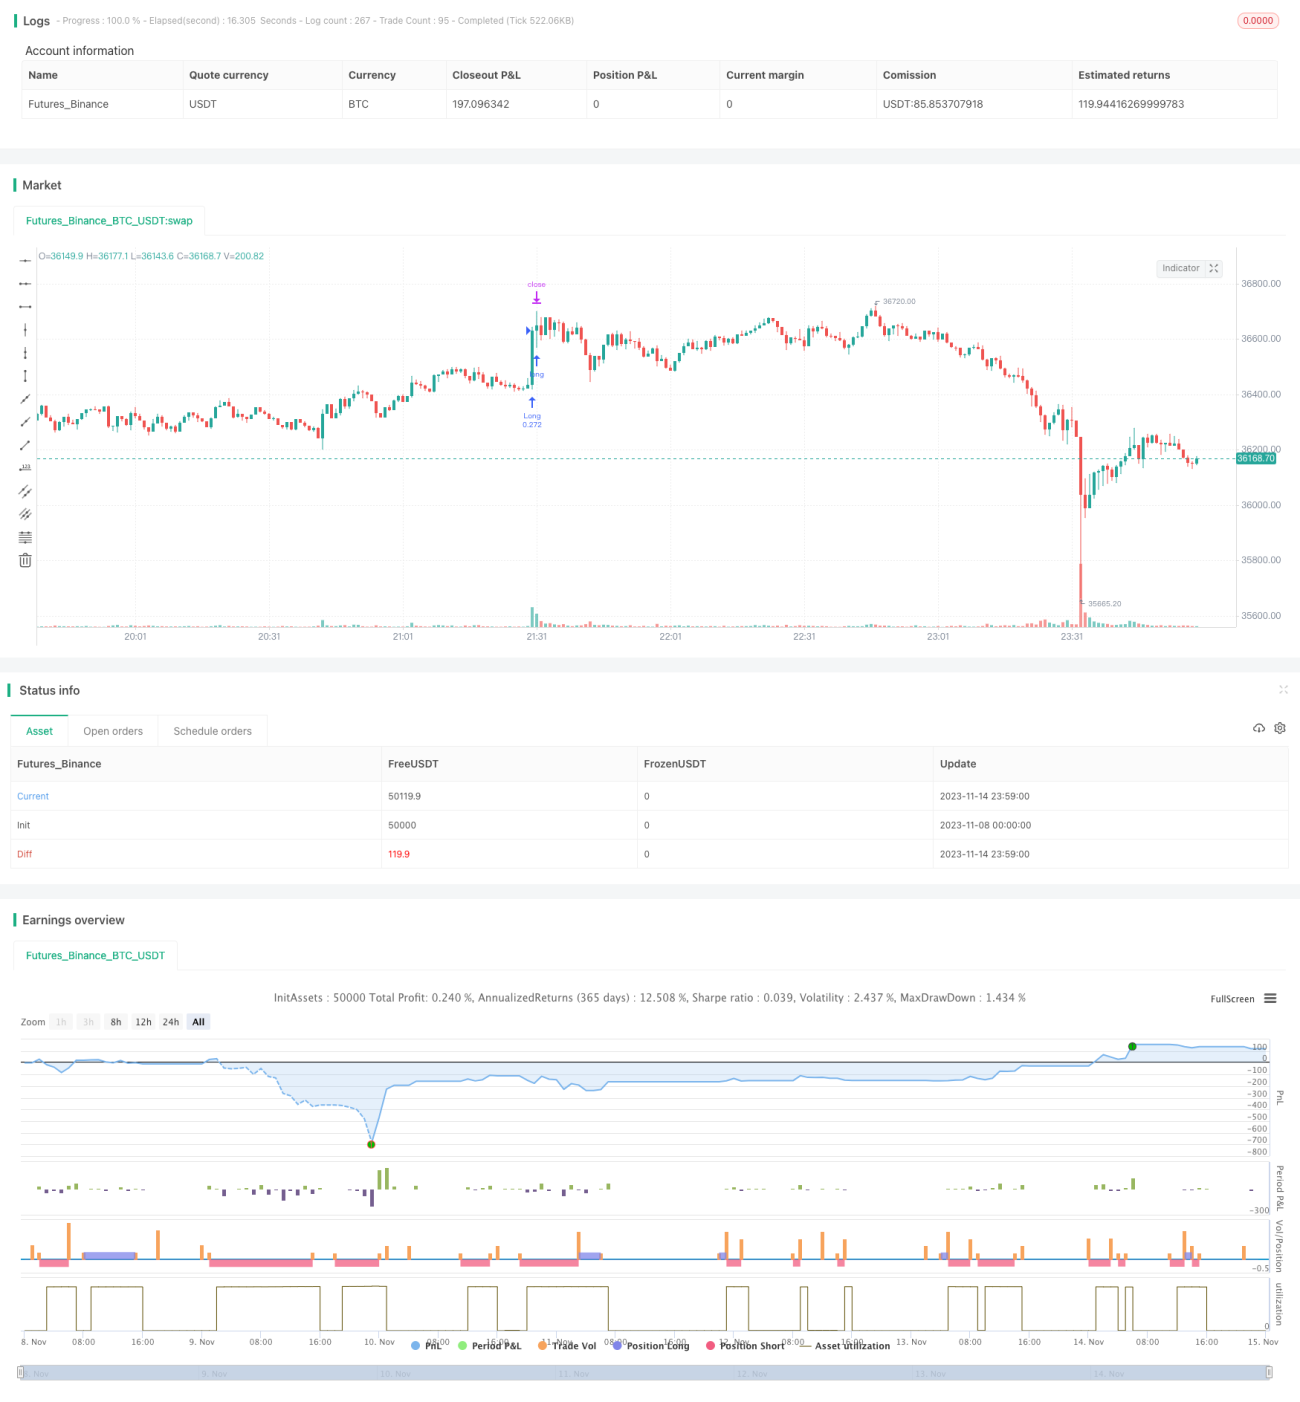
Strategi ini menggunakan berbagai indikator untuk mengidentifikasi arah tren, menggunakan metode pelacakan tren, dan menangkap peluang tren di garis tengah dan pendek. Strategi ini dirancang khusus untuk melacak tren, dengan tujuan untuk meningkatkan tingkat kemenangan dan mengurangi kemunduran.
Prinsip Strategi
-
Menggunakan indikator WVAP untuk menentukan proporsi harga;
-
Indeks RSI menilai pergerakan udara yang berlebihan;
-
Indikator QQE mengidentifikasi terobosan harga;
-
Indikator ADX menilai kekuatan tren;
-
Indikator Coral Trend mengevaluasi pergerakan fundamental.
-
Indeks LSMA membantu menilai tren;
-
Sinyal perdagangan yang digabungkan dengan berbagai indikator.
Strategi ini terutama bergantung pada beberapa indikator untuk menentukan arah dan kekuatan tren, seperti RSI, QQE, ADX, dan menggunakan kurva Coral Trend Indicator sebagai standar dasar untuk menentukan tren. Ketika indikator seperti RSI mengirimkan sinyal beli, jika Coral Trend Indicator juga menunjukkan kurva naik, maka kemungkinan tinggi sesuai dengan tren ke atas, maka strategi ini akan memilih untuk membeli.
Keunggulan Strategis
-
Ini adalah kombinasi dari beberapa indikator untuk meningkatkan keakuratan penilaian.
-
Menekankan untuk melacak tren dan meningkatkan probabilitas keuntungan;
-
Dengan menggunakan ide-ide inovatif, mereka memilah-milah pasar Trading Range.
-
Menghindari perdagangan berlawanan dengan indikator fundamental;
-
Pengaturan waktu dan jam trading yang masuk akal untuk mengurangi risiko;
-
Strategi yang jelas, mudah dipahami dan dioptimalkan.
Keuntungan terbesar dari strategi ini adalah penilaian kombinasi multi-indikator, yang dapat mengurangi probabilitas salah penilaian satu indikator dan meningkatkan akurasi penilaian. Selain itu, strategi ini menambahkan indikator fundamental untuk menghindari operasi berlawanan. Desain ini meningkatkan stabilitas strategi dan probabilitas keuntungan.
Risiko Strategis
-
Di sisi lain, ada beberapa hal yang perlu diperhatikan, antara lain:
-
Pengendalian penarikan tidak sempurna dan ada risiko penarikan yang lebih besar;
-
Strategi dapat melewatkan sinyal ketika fundamental berbalik;
-
Tidak mempertimbangkan biaya transaksi, ada risiko penurunan pendapatan jika diterapkan secara praktis.
Risiko terbesar dari strategi ini adalah bahwa penilaian kombinasi multi-indikator mungkin ada lag, yang menyebabkan kehilangan waktu masuk yang optimal, sehingga mempengaruhi ruang keuntungan. Selain itu, kontrol penarikan kembali strategi tidak ideal, ada risiko penarikan kembali yang lebih besar.
Arah optimasi strategi
-
Ini adalah salah satu strategi yang paling efektif untuk mengurangi risiko kerugian dan mengurangi risiko kerugian.
-
Optimalkan pengaturan parameter untuk mempersingkat keterlambatan indikator.
-
Meningkatkan penggunaan dan akurasi indikator-indikator dasar;
-
Optimalisasi parameter dinamis dengan algoritma pembelajaran mesin.
Fokus optimasi dari strategi ini harus mempertimbangkan pengendalian penarikan, dapat bergabung dengan strategi stop loss bergerak untuk mengunci keuntungan, mengurangi penarikan. Selain itu, dapat meningkatkan penentuan indikator dasar, meningkatkan akurasi. Jika dapat menerapkan metode pembelajaran mesin untuk mengoptimalkan dinamika parameter, juga akan meningkatkan stabilitas strategi secara signifikan.
Meringkaskan
Strategi ini mengintegrasikan berbagai indikator untuk menentukan arah tren, menggunakan desain strategi pelacakan tren, yang bertujuan untuk meningkatkan akurasi penilaian, meningkatkan probabilitas keuntungan. Strategi ini memiliki penilaian kombinasi indikator, menekankan pelacakan tren, menggabungkan dasar-dasar, tetapi juga memiliki masalah seperti kesalahan penilaian, lag, dan kurangnya kontrol penarikan kembali. Di masa depan, strategi dapat ditingkatkan dengan cara mengatur parameter optimasi, memperbaiki strategi stop loss, dan menambahkan indikator dasar, sehingga strategi dapat mencapai efek yang lebih baik dalam aplikasi nyata.
- 1