Strategi penangkapan volatilitas dinamis RSI-Bollinger Bands

Ringkasan
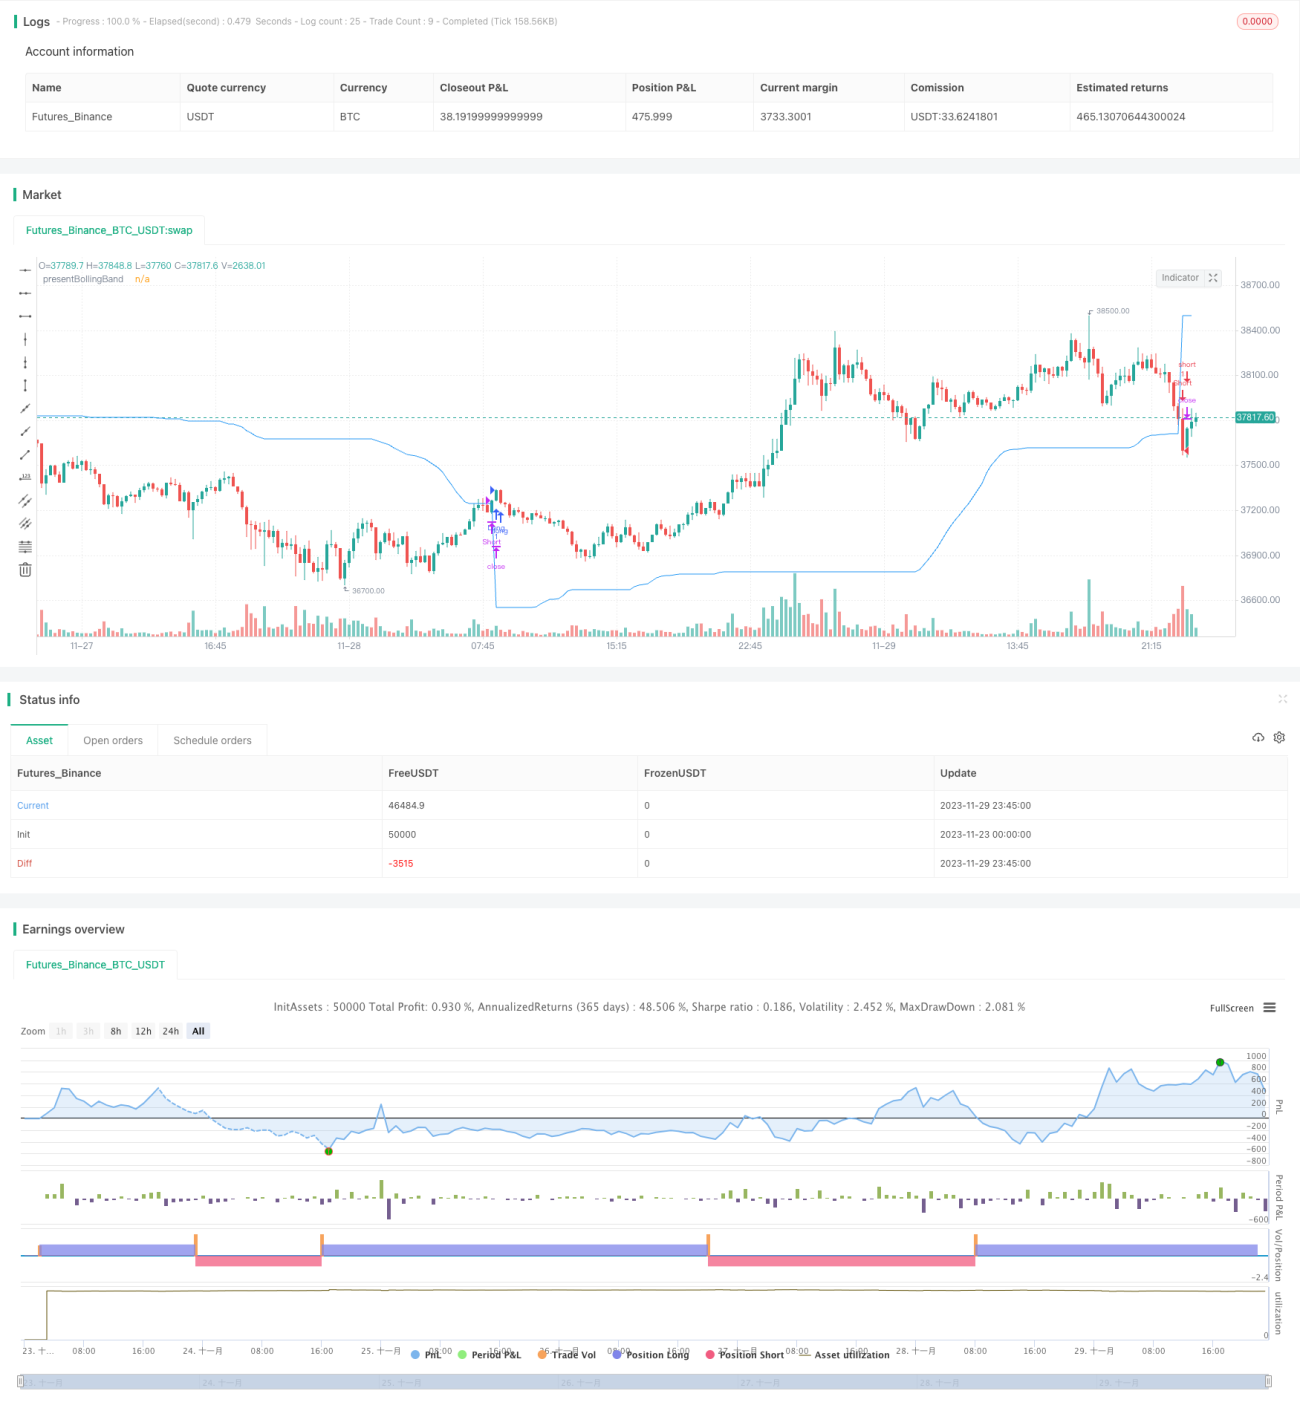
RSI-Bulling Band Strategi adalah strategi perdagangan yang mengintegrasikan konsep Bulling Band (BB), Relatif Lemah Indikator (RSI) dan Sederhana Moving Average (SMA). Strategi ini unik karena menghitung tingkat dinamis antara harga close out di atas dan di bawah rel. Fitur unik ini memungkinkan strategi ini untuk beradaptasi dengan volatilitas pasar dan perubahan harga.
Pasar cryptocurrency dan saham sangat berfluktuasi, sehingga sangat cocok untuk menggunakan strategi Brinks. RSI dapat membantu mengidentifikasi overbought dan oversold di pasar yang sering spekulatif ini.
Prinsip Strategi
Bolling Band Dinamis: Strategi ini pertama-tama menghitung Bolling Band atas dan bawah berdasarkan panjang dan kelipatan yang didefinisikan pengguna. Kemudian menyesuaikan nilai Bolling Band saat ini dengan kombinasi Bolling Band dan harga penutupan yang dinamis.
RSI: Jika pengguna memilih untuk menggunakan RSI untuk menghasilkan sinyal, strategi ini juga menghitung RSI dan SMA, dan menggunakannya untuk menghasilkan sinyal over dan under tambahan.
Strategi ini kemudian memeriksa arah perdagangan yang dipilih, dan masuk ke posisi jual atau jual. Jika arah perdagangan ditetapkan sebagai pivoted, strategi ini dapat masuk ke posisi jual dan jual secara bersamaan.
Akhirnya, jika harga tutup melewati present BollingBand, maka posisi tersebut akan ditutup. Jika harga tutup melewati present BollingBand, maka posisi tersebut akan ditutup.
Analisis Keunggulan
Strategi ini menggabungkan keunggulan dari Brinks, RSI dan SMA, mampu beradaptasi dengan volatilitas pasar, secara dinamis menangkap fluktuasi, menghasilkan sinyal perdagangan dalam kasus overbought dan oversold.
Indikator RSI melengkapi sinyal perdagangan Brin Belt untuk menghindari kesalahan masuk di pasar yang bergoyang. Ini memungkinkan pilihan untuk melakukan perdagangan hanya lebih, hanya lebih atau dua arah, sesuai dengan kondisi pasar yang berbeda.
Parameter dapat disesuaikan dengan preferensi risiko pribadi.
Analisis risiko
Strategi ini bergantung pada indikator-indikator teknis dan tidak mampu menghadapi pergeseran besar yang disebabkan oleh fundamental.
Setting parameter Brinband yang tidak tepat dapat menyebabkan sinyal perdagangan yang terlalu sering atau terlalu jarang.
Perdagangan dua arah meningkatkan risiko, dan perlu waspada terhadap kerugian akibat melakukan shorting.
Disarankan untuk mengontrol risiko dengan menggunakan stop loss.
Arah optimasi
-
Kombinasi dengan indikator lain untuk memfilter sinyal, seperti MACD.
-
Meningkatkan strategi stop loss.
-
Optimalkan parameter BRI dan RSI.
-
Parameter disesuaikan dengan jenis dan siklus transaksi yang berbeda.
-
Pertimbangkan untuk mengoptimalkan hard disk, menyesuaikan parameter untuk menyesuaikan dengan situasi yang sebenarnya.
Meringkaskan
Strategi ini merupakan strategi yang didorong oleh indikator-indikator teknis, yang menggabungkan keunggulan dari indikator Brin, RSI, dan SMA, untuk menangkap pergerakan pasar melalui penyesuaian dinamis Brin. Strategi ini dapat disesuaikan dan dioptimalkan dengan ruang yang luas, tetapi tidak dapat memprediksi perubahan fundamental.
- 1