Strategi Perdagangan Persentase Bollinger Bands

Ringkasan
Strategi ini didasarkan pada indikator Bollinger Bands, digabungkan dengan Moving Average dan ATR Technical Indicators, untuk mewujudkan sistem breakout dengan periode pendek. Strategi ini menghasilkan sinyal perdagangan dengan menghitung persentase posisi relatif harga dalam saluran Bollinger Bands untuk menilai kondisi harga overbought dan oversold, digabungkan dengan breakout baru pada titik tinggi dan rendah.
Prinsip Strategi
- Perhitungan Brin Belt dan persentase harga dalam Brin Belt
- Rata-rata bergerak dihitung untuk harga buka, tutup, tertinggi dan terendah
- Menghitung indikator ATR dan menetapkan stop loss line digabungkan dengan ATR
- Menentukan apakah harga berada di dekat titik tinggi atau rendah baru
- Perbandingan harga tertinggi dan terendah tahun ini untuk menilai tingkat besar.
- Apakah sinyal perdagangan dikirim melalui perubahan persentase Brin dan kenaikan dan penurunan baru
Strategi ini menggunakan Bollinger Bands untuk menentukan volatilitas pasar, dengan lebar Bollinger Bands ditentukan melalui standar deviasi. Harga adalah titik beli ketika harga dari Bollinger Bands turun dan harga adalah titik jual ketika harga dari Bollinger Bands naik. Rata-rata bergerak dapat meratakan pergerakan Bollinger Bands, mengurangi false breakout. Indikator ATR digabungkan dengan Stop Loss Line yang bergerak, dengan stop loss tetap.
Keunggulan Strategis
- Penghakiman Brin Beltway yang ketat dapat mengurangi sinyal palsu
- Moving Average untuk Meluruskan Harga dan Mengidentifikasi Tren Nyata
- ATR Indeks Dinamis Mengikuti Stop Loss, Membatasi Kerugian Tunggal
- Penghitungan tinggi baru dan rendah baru dan rendah tahunan, membuat sinyal lebih dapat diandalkan
- Mengintegrasikan berbagai indikator teknis untuk meningkatkan efektivitas strategi
Risiko Strategis dan Solusi
- Setting parameter Brin Beltway yang tidak tepat dapat menyebabkan terlalu banyak false breaks, dan kombinasi parameter yang berbeda harus diuji untuk hasil yang optimal
- Harga penutupan sebagai garis dasar mungkin terjadi penarikan balik melebihi stop loss yang ditetapkan ATR, dapat dipertimbangkan untuk menghitung persentase harga tertinggi dan terendah dengan menggunakan gelombang yang lebih besar
- Blink yang ketat dengan filter mungkin akan kehilangan peluang tren pada garis yang lebih panjang, dengan kondisi filter yang lebih longgar dan waktu memegang posisi yang lebih longgar
- Indikator ATR lebih lambat untuk melacak fluktuasi harga yang besar, dan indikator fluktuasi frekuensi yang lebih tinggi seperti real amplitude harus dipertimbangkan
- Penembusan baru yang tinggi dan baru yang rendah rentan terhadap gangguan dari kebisingan jangka pendek, yang harus dievaluasi secara signifikan dan berkelanjutan
Arah optimasi strategi
- Pengujian kombinasi parameter yang berbeda untuk menentukan parameter terbaik dan panjang rata-rata bergerak
- Menggunakan kombinasi model yang menggabungkan parameter Brin band yang berbeda atau sinyal penghakiman moving average
- Uji kesesuaian parameter untuk periode waktu yang berbeda dan varietas yang berbeda, meningkatkan stasionalitas
- Kombinasi dengan lebih banyak kriteria skala besar, seperti sinyal pita Brin pada skala solar atau faktor musiman
- Evaluasi peluang mengikuti tren untuk memperluas jangkauan strategi dan ruang untuk keuntungan
Meringkaskan
Strategi ini menggabungkan beberapa alat teknis, seperti persentase Brin-band, moving average, indikator ATR, new highs, new lows, dan highs and lows tahunan, untuk membangun strategi perdagangan terobosan yang relatif ketat dan efisien dalam jangka pendek. Kelebihannya yang menonjol adalah memanfaatkan berbagai macam alat untuk mengurangi kebisingan dan mengidentifikasi sinyal tren yang sebenarnya. Tentu saja, strategi ini juga memiliki beberapa parameter yang menentukan kesulitan dan kemungkinan kehilangan peluang di bawah kondisi yang ketat.
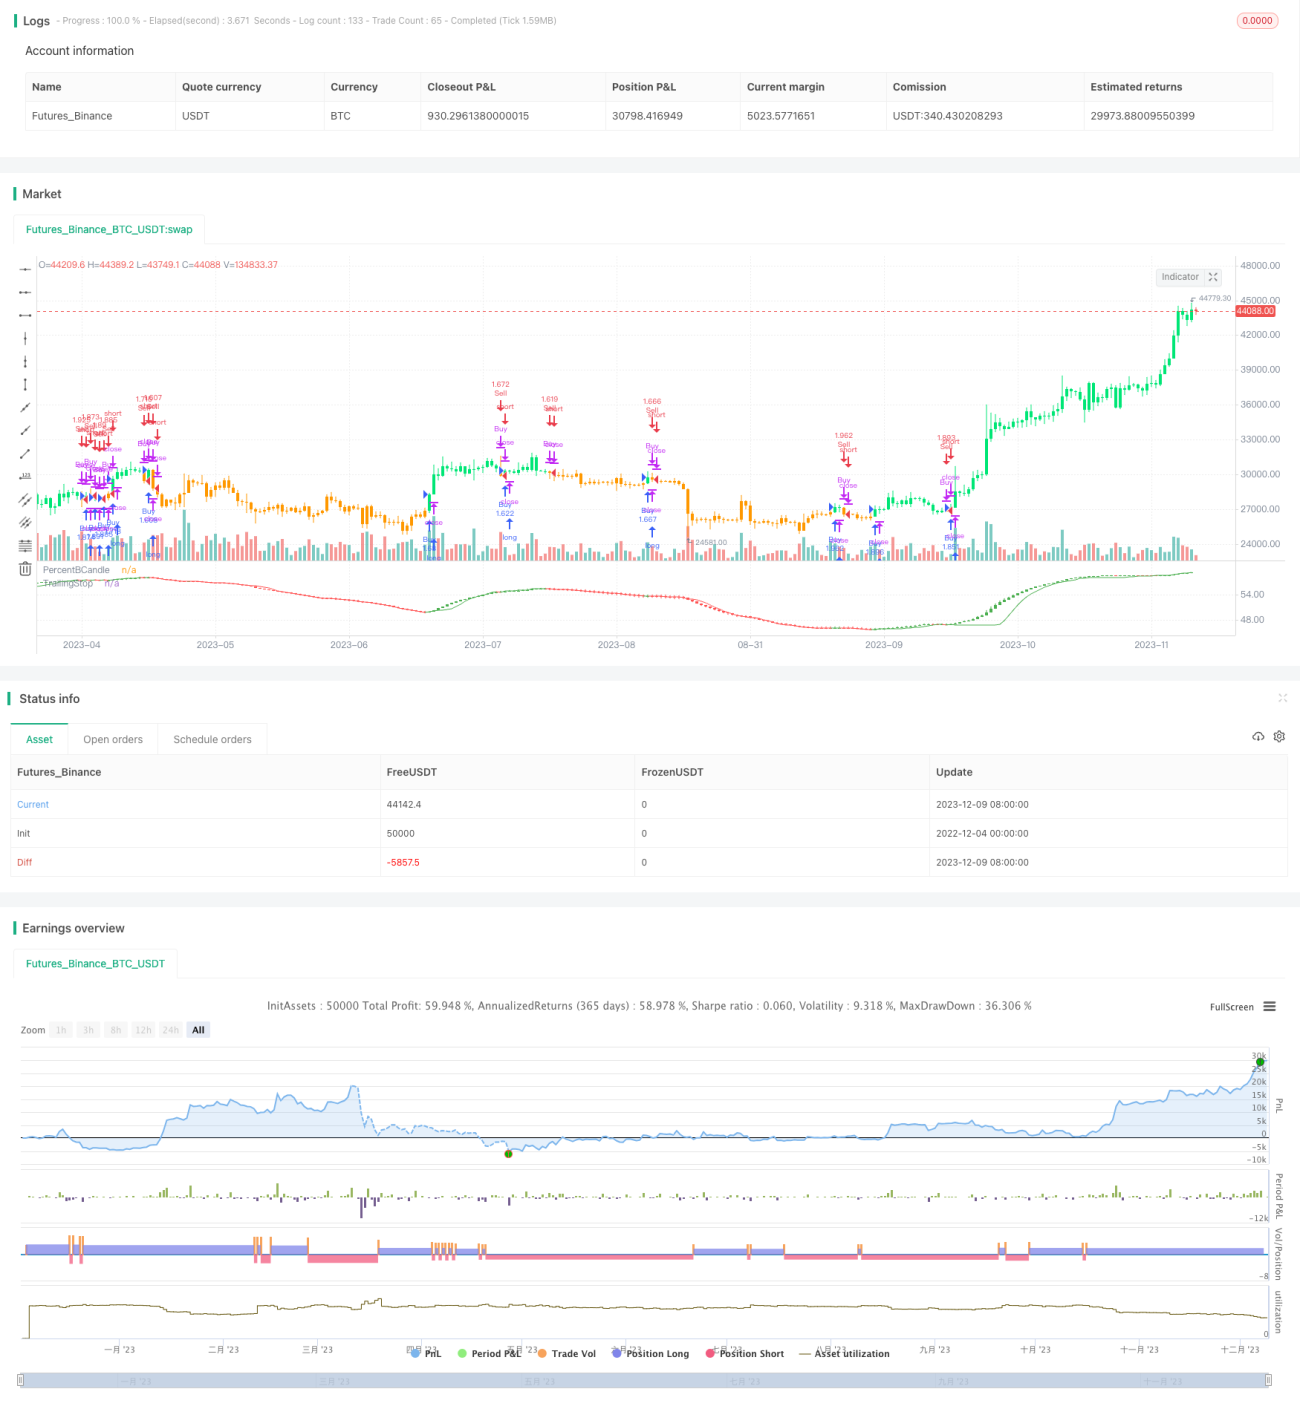
/*backtest
start: 2022-12-04 00:00:00
end: 2023-12-10 00:00:00
period: 1d
basePeriod: 1h
exchanges: [{"eid":"Futures_Binance","currency":"BTC_USDT"}]
*/

// This source code is subject to the terms of the Mozilla Public License 2.0 at https://mozilla.org/MPL/2.0/
// © HeWhoMustNotBeNamed

//@version=4- 1