Strategi perdagangan multi-kerangka waktu berdasarkan indikator volatilitas dan indikator stokastik
Ringkasan
Strategi ini menggabungkan indikator volatilitas VIX dan indikator acak RSI, dengan kombinasi indikator periode waktu yang berbeda, untuk mencapai breakout yang efisien dan overbought oversold stop loss position. Strategi memiliki ruang untuk pengoptimalan yang besar dan dapat disesuaikan dengan lingkungan pasar yang berbeda.
Prinsip Strategi
Menghitung indikator volatilitas VIX: Menghitung volatilitas harga tertinggi dan terendah dalam 20 hari terakhir. Ketika volatilitas lebih tinggi dari jalur atas, menunjukkan kepanikan pasar; Ketika lebih rendah dari jalur bawah, menunjukkan market compliance.
Perhitungan RSI acak: Perhitungan kenaikan dan penurunan dalam 14 hari terakhir, ketika RSI di atas 70 adalah zona overbought, dan di bawah 30 adalah zona oversold.
Merger dua indikator, melakukan lebih banyak ketika volatilitas lebih tinggi dari tren atas atau persentase tertinggi; posisi terendah ketika RSI lebih tinggi dari 70.
Keunggulan Strategis
- Menggabungkan berbagai indikator untuk menilai pasar secara menyeluruh.
- Perbedaan indikator siklus waktu saling memverifikasi, meningkatkan akurasi pengambilan keputusan.
- Parameter penyesuaian dapat dioptimalkan untuk menyesuaikan varietas perdagangan yang berbeda.
Analisis risiko
- Setting parameter yang tidak tepat dapat menyebabkan beberapa kali sinyal palsu.
- Indikator posisi kosong tunggal mudah melewatkan harga yang berbalik.
Saran untuk Optimasi
- Menambahkan lebih banyak indikator verifikasi, seperti garis rata-rata, garis putar, dan lain-lain untuk menentukan waktu masuk.
- Menambahkan lebih banyak indikator posisi kosong, seperti bentuk K-line yang terbalik.
Meringkaskan
Strategi ini menggunakan indikator VIX untuk menilai waktu pasar dan tingkat risiko, bekerja sama dengan indikator RSI untuk memfilter titik perdagangan yang tidak menguntungkan dari overbought dan oversold, sehingga membeli pada waktu yang efisien dan menghentikan kerugian tepat waktu. Strategi memiliki ruang optimasi yang lebih besar dan dapat disesuaikan dengan lingkungan pasar yang lebih luas.
/*backtest
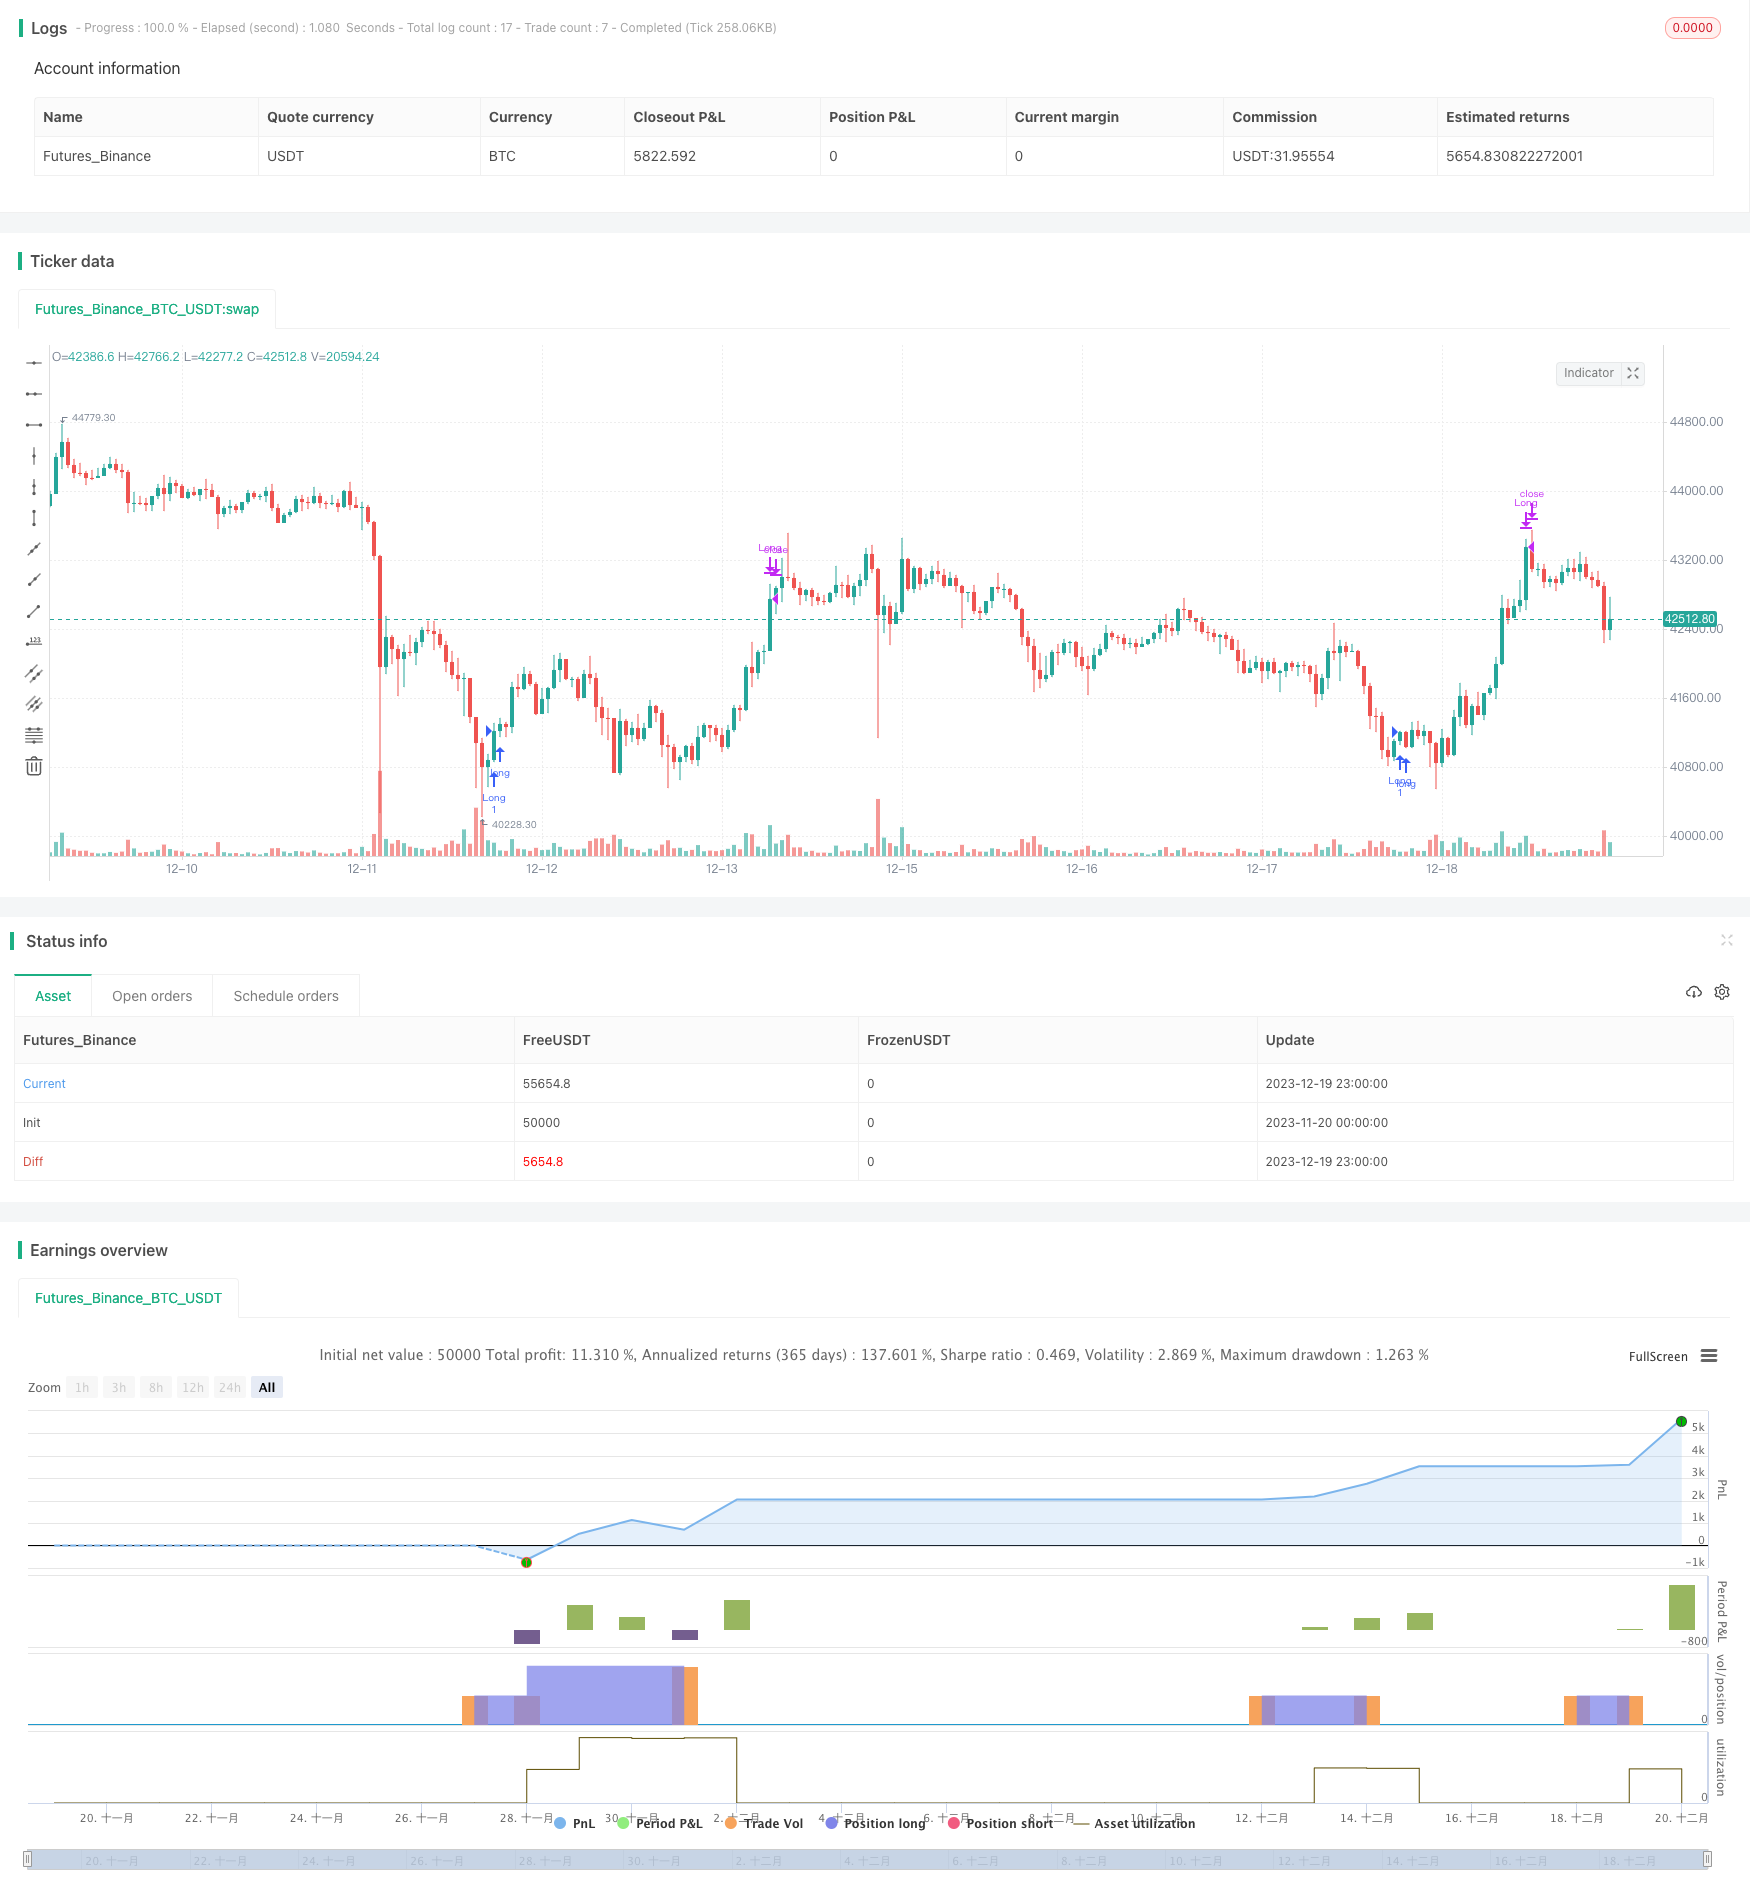
start: 2023-11-20 00:00:00
end: 2023-12-20 00:00:00
period: 1h
basePeriod: 15m
exchanges: [{"eid":"Futures_Binance","currency":"BTC_USDT"}]
*/
//@version=5
// This source code is subject to the terms of the Mozilla Public License 2.0 at https://mozilla.org/MPL/2.0/
// © timj
strategy('Vix FIX / StochRSI Strategy', overlay=true, pyramiding=9, margin_long=100, margin_short=100)
Stochlength = input.int(14, minval=1, title="lookback length of Stochastic")
StochOverBought = input.int(80, title="Stochastic overbought condition")
StochOverSold = input.int(20, title="Stochastic oversold condition")
smoothK = input(3, title="smoothing of Stochastic %K ")
smoothD = input(3, title="moving average of Stochastic %K")
k = ta.sma(ta.stoch(close, high, low, Stochlength), smoothK)
d = ta.sma(k, smoothD)
///////////// RSI
RSIlength = input.int( 14, minval=1 , title="lookback length of RSI")
RSIOverBought = input.int( 70 , title="RSI overbought condition")
RSIOverSold = input.int( 30 , title="RSI oversold condition")
RSIprice = close
vrsi = ta.rsi(RSIprice, RSIlength)
///////////// Double strategy: RSI strategy + Stochastic strategy
pd = input(22, title="LookBack Period Standard Deviation High")
bbl = input(20, title="Bolinger Band Length")
mult = input.float(2.0 , minval=1, maxval=5, title="Bollinger Band Standard Devaition Up")
lb = input(50 , title="Look Back Period Percentile High")
ph = input(.85, title="Highest Percentile - 0.90=90%, 0.95=95%, 0.99=99%")
new = input(false, title="-------Text Plots Below Use Original Criteria-------" )
sbc = input(false, title="Show Text Plot if WVF WAS True and IS Now False")
sbcc = input(false, title="Show Text Plot if WVF IS True")
new2 = input(false, title="-------Text Plots Below Use FILTERED Criteria-------" )
sbcFilt = input(true, title="Show Text Plot For Filtered Entry")
sbcAggr = input(true, title="Show Text Plot For AGGRESSIVE Filtered Entry")
ltLB = input.float(40, minval=25, maxval=99, title="Long-Term Look Back Current Bar Has To Close Below This Value OR Medium Term--Default=40")
mtLB = input.float(14, minval=10, maxval=20, title="Medium-Term Look Back Current Bar Has To Close Below This Value OR Long Term--Default=14")
str = input.int(3, minval=1, maxval=9, title="Entry Price Action Strength--Close > X Bars Back---Default=3")
//Alerts Instructions and Options Below...Inputs Tab
new4 = input(false, title="-------------------------Turn On/Off ALERTS Below---------------------" )
new5 = input(false, title="----To Activate Alerts You HAVE To Check The Boxes Below For Any Alert Criteria You Want----")
sa1 = input(false, title="Show Alert WVF = True?")
sa2 = input(false, title="Show Alert WVF Was True Now False?")
sa3 = input(false, title="Show Alert WVF Filtered?")
sa4 = input(false, title="Show Alert WVF AGGRESSIVE Filter?")
//Williams Vix Fix Formula
wvf = ((ta.highest(close, pd)-low)/(ta.highest(close, pd)))*100
sDev = mult * ta.stdev(wvf, bbl)
midLine = ta.sma(wvf, bbl)
lowerBand = midLine - sDev
upperBand = midLine + sDev
rangeHigh = (ta.highest(wvf, lb)) * ph
//Filtered Bar Criteria
upRange = low > low[1] and close > high[1]
upRange_Aggr = close > close[1] and close > open[1]
//Filtered Criteria
filtered = ((wvf[1] >= upperBand[1] or wvf[1] >= rangeHigh[1]) and (wvf < upperBand and wvf < rangeHigh))
filtered_Aggr = (wvf[1] >= upperBand[1] or wvf[1] >= rangeHigh[1]) and not (wvf < upperBand and wvf < rangeHigh)
//Alerts Criteria
alert1 = wvf >= upperBand or wvf >= rangeHigh ? 1 : 0
alert2 = (wvf[1] >= upperBand[1] or wvf[1] >= rangeHigh[1]) and (wvf < upperBand and wvf < rangeHigh) ? 1 : 0
alert3 = upRange and close > close[str] and (close < close[ltLB] or close < close[mtLB]) and filtered ? 1 : 0
alert4 = upRange_Aggr and close > close[str] and (close < close[ltLB] or close < close[mtLB]) and filtered_Aggr ? 1 : 0
//Coloring Criteria of Williams Vix Fix
col = wvf >= upperBand or wvf >= rangeHigh ? color.lime : color.gray
isOverBought = (ta.crossover(k,d) and k > StochOverBought) ? 1 : 0
isOverBoughtv2 = k > StochOverBought ? 1 : 0
filteredAlert = alert3 ? 1 : 0
aggressiveAlert = alert4 ? 1 : 0
if (filteredAlert or aggressiveAlert)
strategy.entry("Long", strategy.long)
if (isOverBought)
strategy.close("Long")