Strategi Pemotongan Pita Volatilitas Ganda
Ringkasan
Strategi penutupan pita gelombang ganda adalah strategi perdagangan garis pendek yang menggunakan indikator pita gelombang. Ini menggunakan pita gelombang dengan dua parameter yang berbeda, baik cepat maupun lambat, untuk mencari peluang perdagangan saat pita gelombang melakukan penembusan ke atas atau ke bawah.
Prinsip Strategi
Strategi ini menggunakan panjang 20 dan 50 dengan perbedaan standar 1 untuk band volatilitas cepat dan lambat pada saat yang sama. Ketika harga penutupan menembus band volatilitas cepat, masuk ke posisi terbalik dengan harga penutupan itu.
Setelah memasuki posisi, strategi akan menunggu harga untuk terus menerus menerobos pita fluktuasi lambat ke atas atau ke bawah, sebagai sinyal konfirmasi lebih lanjut. Selain itu, strategi juga akan digabungkan dengan indikator RSI untuk menentukan arah tren.
Setelah posisi terbentuk, jika harga kembali menembus jalur pergerakan cepat naik atau turun, maka posisi multihead atau kosong akan keluar.
Analisis Keunggulan
Keuntungan dari strategi penutupan dual bands adalah kemampuan untuk menangkap pergerakan kecil. Dengan bands yang cepat, Anda dapat menangkap pergerakan kecil, dan band yang lambat, Anda dapat memverifikasi kembali sinyal, memfilter kebisingan dari pergerakan palsu, dan mendapatkan keuntungan dari itu.
Selain itu, pita gelombang ganda itu sendiri sebagai indikator momentum, dapat dengan baik menilai apakah pasar saat ini berada dalam fase momentum tinggi, yang sangat menguntungkan untuk strategi perdagangan garis pendek.
Analisis risiko
Risiko utama dari strategi ini adalah bahwa sinyal perdagangan yang dihasilkan oleh dual band mungkin terlalu sering dan tidak dapat menyaring kebisingan pasar secara efektif. Ini dapat menyebabkan akumulasi kerugian perdagangan yang terlalu banyak. Selain itu, pada tahap pergerakan kecepatan rendah, lebar band bergelombang menyempit dan peluang perdagangan akan berkurang.
Untuk mengurangi risiko, dapat dipertimbangkan untuk menyesuaikan parameter pita gelombang, menggunakan pita gelombang lambat dengan periode yang lebih lama, atau secara manual mengkonfirmasi kembali sinyal. Dapat juga dikombinasikan dengan indikator teknis lainnya, seperti MACD, KDJ, dan lain-lain, untuk meningkatkan stabilitas strategi.
Arah optimasi
Ruang optimasi untuk strategi ini terutama berfokus pada pengaturan parameter band oscillation dan parameter RSI. Misalnya, Anda dapat menguji parameter band oscillasi cepat dan lambat untuk periode panjang yang berbeda untuk menemukan kombinasi optimal. Atau mencoba parameter indikator RSI untuk periode panjang yang berbeda untuk melihat apakah kinerja strategi dapat ditingkatkan.
Arah optimasi lainnya adalah dengan menambahkan atau menyesuaikan logika stop loss. Strategi saat ini tidak memiliki set stop loss, yang meningkatkan risiko penarikan maksimum dari strategi. Set stop loss atau tracking stop loss yang tepat dapat secara signifikan meningkatkan risiko-pengembalian.
Meringkaskan
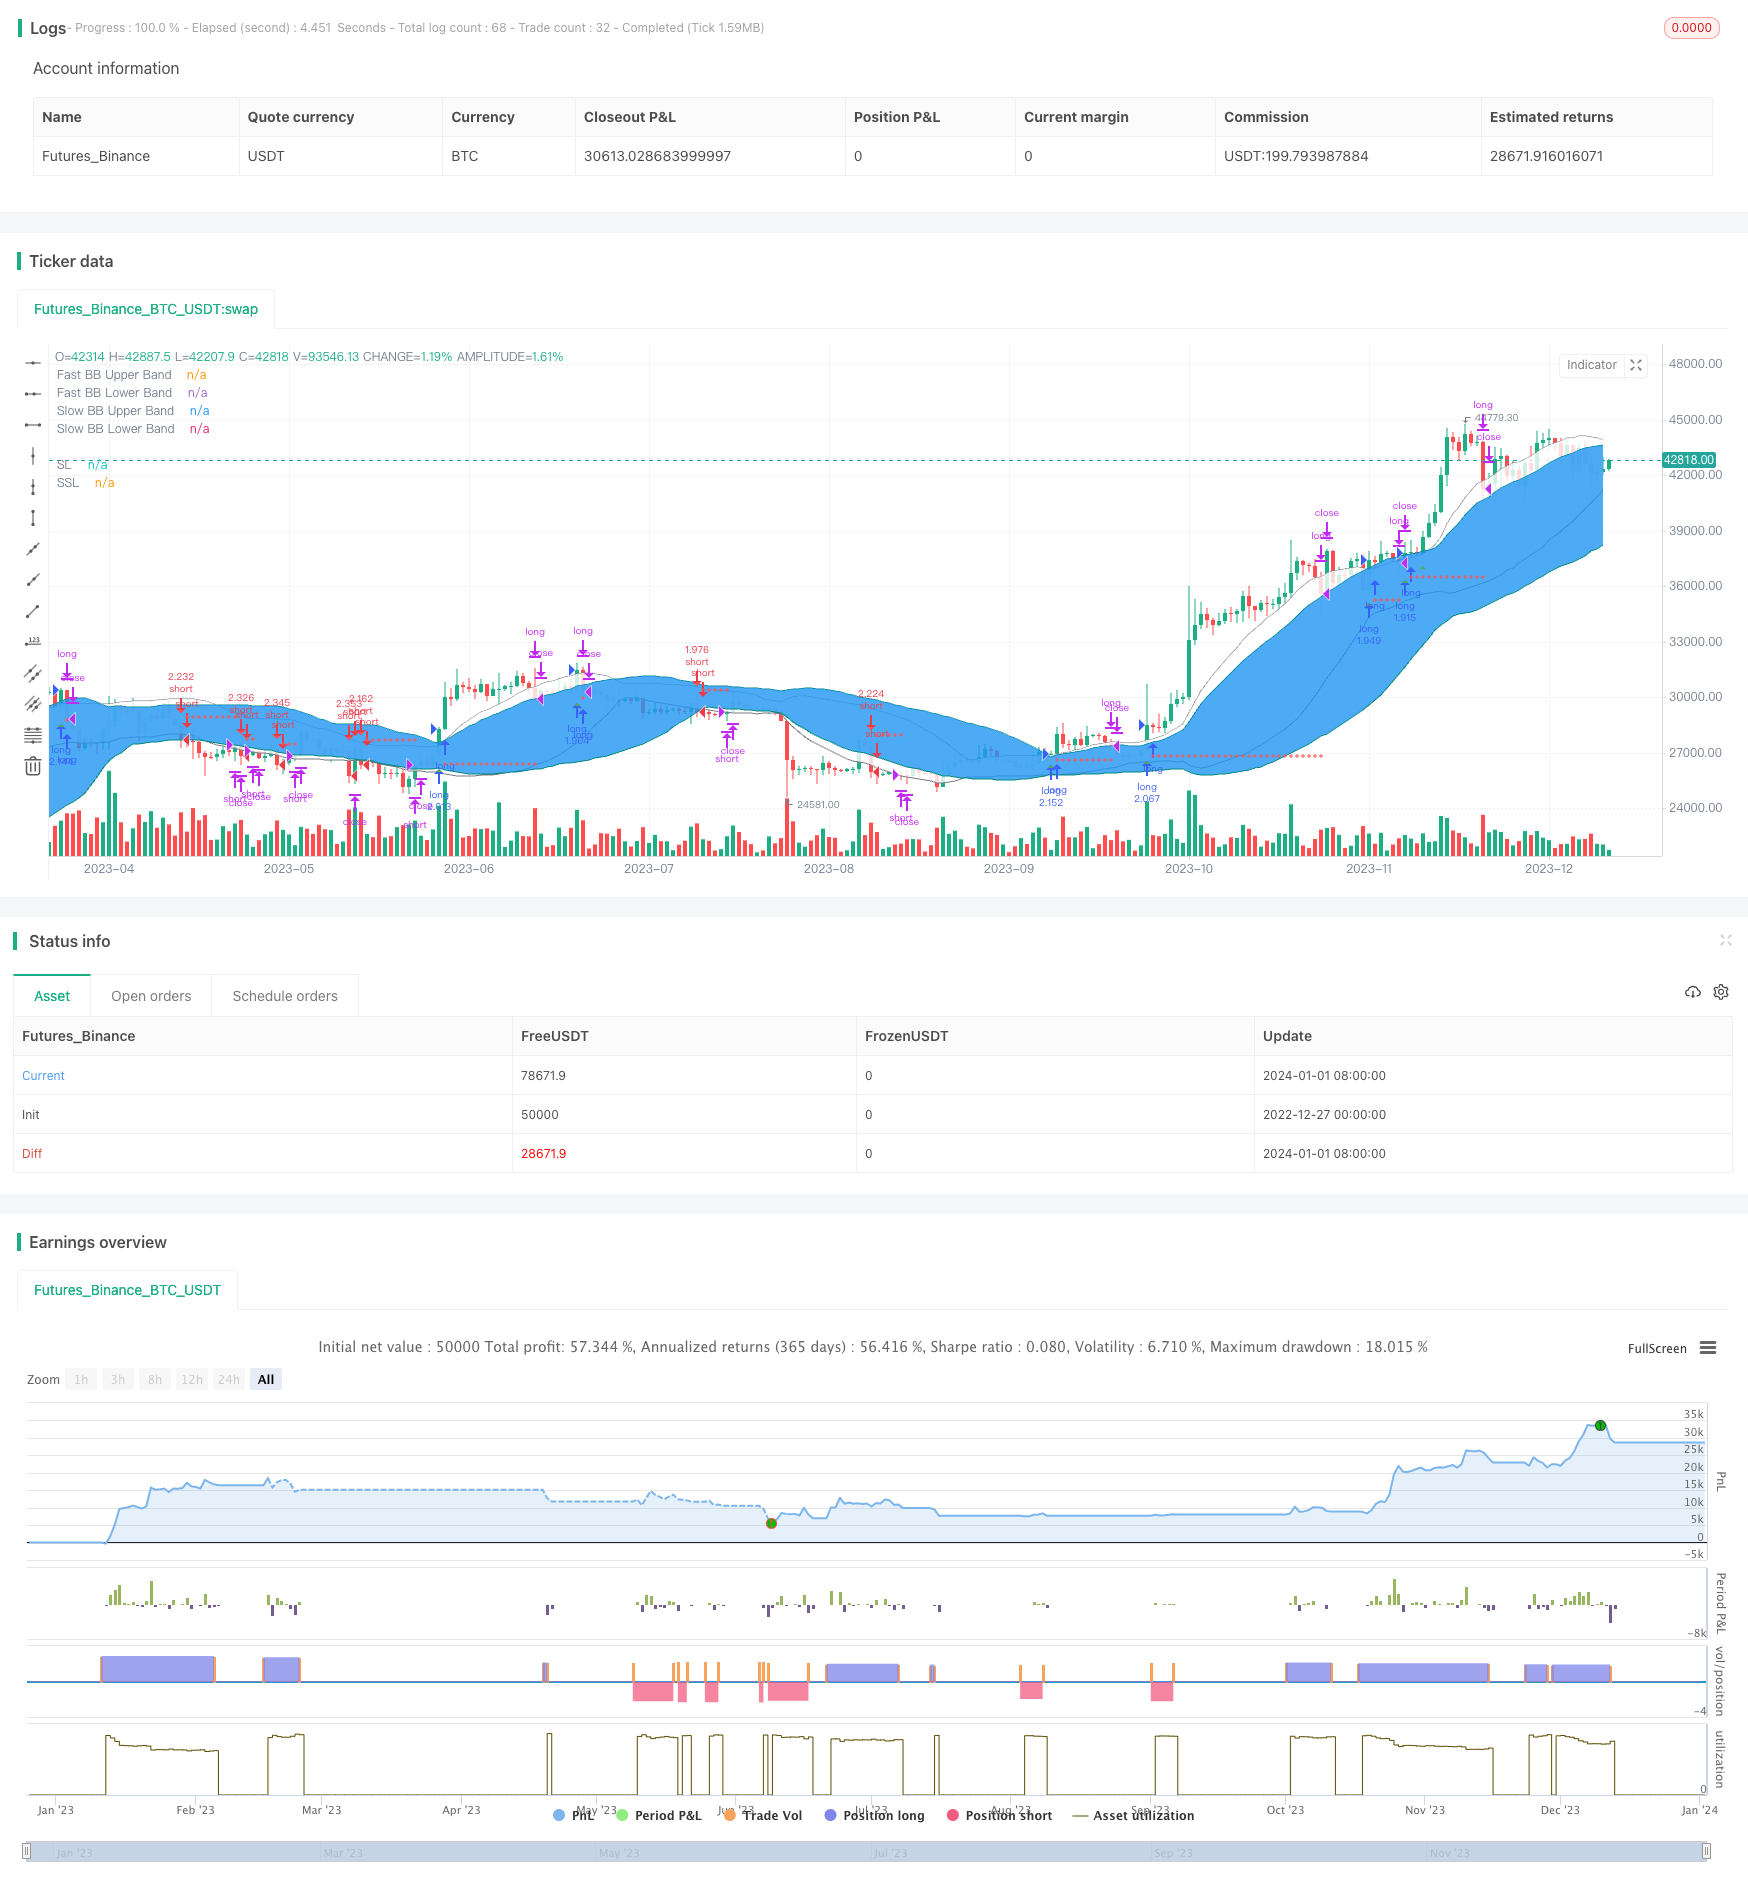
Strategi penutupan pita gelombang ganda adalah strategi perdagangan garis pendek yang sensitif terhadap dinamika pasar. Ini dapat menangkap pergerakan harga kecil dalam situasi yang sangat berfluktuasi, dan melakukan perdagangan ketika indikator pita gelombang ganda mengeluarkan sinyal yang jelas. Namun, keandalan strategi ini masih harus diverifikasi lebih lanjut, dengan penambahan optimasi parameter dan logika stop loss, diharapkan untuk meningkatkan stabilitas strategi lebih lanjut.
/*backtest
start: 2022-12-27 00:00:00
end: 2024-01-02 00:00:00
period: 1d
basePeriod: 1h
exchanges: [{"eid":"Futures_Binance","currency":"BTC_USDT"}]
*/

// This source code is subject to the terms of the Mozilla Public License 2.0 at https://mozilla.org/MPL/2.0/

// From "Bitcoin Trading Strategies: Algorithmic Trading Strategies For Bitcoin And Cryptocurrency That Work" by David Hanson.

// "Double Bolinger Band Scalping System
// Recommended Timeframe: 1 minute or 5 minute

// Required Indicators:
// - RSI with a length of 14 (default settings)
// - Bolinger band #1 settings: Length = 50, stDev = 1 Hide the basis/middle line (basis line not needed for this strategy)
// Note: This is the slower bolinger band in the directions
// - Bolinger band #2 settings: Length 20, stDev = 1 Hide the basis/middle line (basis line not needed for this strategy)
// Note: This is the faster bolinger band in the directions

// Enter Long/Buy Trade When:
// - RSI is above the level 50
// - A candle closes above the top of the faster bolinger band
// Enter a long when a candle then closes above the top of the slower bolinger band, and price is above the top of both bands
// Place a stop loss under the low of the entry candle Example of a long trade using this strategy
// Exit Long Trade When: A candle closes below the top band of the fast bolinger band

// Enter Short/Sell Trade When:
// - RSI is below the level 50
// - A candle closes below the bottom of the faster bolinger band
// Enter a short when a candle then closes below the bottom of the slower bolinger band, and price is below both bands
// Place a stop loss above the high of the entry candle Example of a short trade using this strategy
// Exit Short Trade When: Price closes inside the bottom of the faster bolinger band"

// © tweakerID

//@version=4
strategy("Double Bollinger Strategy",
     overlay=true,
     default_qty_type=strategy.percent_of_equity,
     default_qty_value=100,
     initial_capital=10000,
     commission_value=0.04,
     calc_on_every_tick=false,
     slippage=0)

direction = input(0, title = "Strategy Direction", type=input.integer, minval=-1, maxval=1)
strategy.risk.allow_entry_in(direction == 0 ? strategy.direction.all : (direction < 0 ? strategy.direction.short : strategy.direction.long))

/////////////////////// STRATEGY INPUTS ////////////////////////////////////////
title1=input(true, "-----------------Strategy Inputs-------------------")

i_RSI=input(14, title="RSI Length")
lengthS = input(45, minval=1, title="Slow BB Band Length")
lengthF = input(31, minval=1, title="Fast BB Band Length")

/////////////////////// BACKTESTER /////////////////////////////////////////////
title2=input(true, "-----------------General Inputs-------------------")

// Backtester General Inputs
i_SL=input(true, title="Use Stop Loss and Take Profit")
i_SLType=input(defval="Strategy Stop", title="Type Of Stop", options=["Strategy Stop", "Swing Lo/Hi", "ATR Stop"])
i_SPL=input(defval=10, title="Swing Point Lookback")
i_PercIncrement=input(defval=1, step=.1, title="Swing Point SL Perc Increment")*0.01
i_ATR = input(14, title="ATR Length")
i_ATRMult = input(5, step=.1, title="ATR Multiple")
i_TPRRR = input(2, step=.1, title="Take Profit Risk Reward Ratio")
TS=input(false, title="Trailing Stop")

// Bought and Sold Boolean Signal
bought = strategy.position_size > strategy.position_size[1]
 or strategy.position_size < strategy.position_size[1]

// Price Action Stop and Take Profit
LL=(lowest(i_SPL))*(1-i_PercIncrement)
HH=(highest(i_SPL))*(1+i_PercIncrement)
LL_price = valuewhen(bought, LL, 0)
HH_price = valuewhen(bought, HH, 0)
entry_LL_price = strategy.position_size > 0 ? LL_price : na
entry_HH_price = strategy.position_size < 0 ? HH_price : na
tp=strategy.position_avg_price + (strategy.position_avg_price - entry_LL_price)*i_TPRRR
stp=strategy.position_avg_price - (entry_HH_price - strategy.position_avg_price)*i_TPRRR

// ATR Stop
ATR=atr(i_ATR)*i_ATRMult
ATRLong = ohlc4 - ATR
ATRShort = ohlc4 + ATR
ATRLongStop = valuewhen(bought, ATRLong, 0)
ATRShortStop = valuewhen(bought, ATRShort, 0)
LongSL_ATR_price = strategy.position_size > 0 ? ATRLongStop : na
ShortSL_ATR_price = strategy.position_size < 0 ? ATRShortStop : na
ATRtp=strategy.position_avg_price + (strategy.position_avg_price - LongSL_ATR_price)*i_TPRRR
ATRstp=strategy.position_avg_price - (ShortSL_ATR_price - strategy.position_avg_price)*i_TPRRR


// Strategy Stop
float LongStop = valuewhen(bought,low[1],0)*(1-i_PercIncrement)
float ShortStop = valuewhen(bought,high[1],0)*(1+i_PercIncrement)
float StratTP = na
float StratSTP = na

/////////////////////// STRATEGY LOGIC /////////////////////////////////////////

//RSI
RSI=rsi(close, i_RSI)

//BOLL1
[middleS, upperS, lowerS] = bb(close, lengthS, 1)
p1 = plot(upperS, "Slow BB Upper Band", color=color.teal)
p2 = plot(lowerS, "Slow BB Lower Band", color=color.teal)
fill(p1, p2, title = "Slow BB Background", color=color.blue, transp=95)

//BOLL2
[middleF, upperF, lowerF] = bb(close, lengthF, 1)
p1F = plot(upperF, "Fast BB Upper Band", color=color.gray)
p2F = plot(lowerF, "Fast BB Lower Band", color=color.gray)
fill(p1F, p2F, title = "Fast BB Background", color=color.white, transp=95)


BUY = bar_index > 40 and (RSI > 50) and (close > upperF) and crossover(close, upperS)
SELL = bar_index > 40 and (RSI < 50) and (close < lowerF) and crossunder(close, lowerS)

longexit=close < upperF
shortexit=close > lowerF

//Trading Inputs
i_strategyClose=input(true, title="Use Strategy Close Logic")
DPR=input(true, "Allow Direct Position Reverse")
reverse=input(false, "Reverse Trades")

// Entries
if reverse
    if not DPR
        strategy.entry("long", strategy.long, when=SELL and strategy.position_size == 0)
        strategy.entry("short", strategy.short, when=BUY and strategy.position_size == 0)
    else
        strategy.entry("long", strategy.long, when=SELL)
        strategy.entry("short", strategy.short, when=BUY)
else
    if not DPR
        strategy.entry("long", strategy.long, when=BUY and strategy.position_size == 0)
        strategy.entry("short", strategy.short, when=SELL and strategy.position_size == 0)
    else
        strategy.entry("long", strategy.long, when=BUY)
        strategy.entry("short", strategy.short, when=SELL)

if i_strategyClose
    strategy.close("long", when=longexit)
    strategy.close("short", when=shortexit)


SL= i_SLType == "Swing Lo/Hi" ? entry_LL_price : i_SLType == "ATR Stop" ? LongSL_ATR_price : LongStop
SSL= i_SLType == "Swing Lo/Hi" ? entry_HH_price : i_SLType == "ATR Stop" ? ShortSL_ATR_price : ShortStop
TP= i_SLType == "Swing Lo/Hi" ? tp : i_SLType == "ATR Stop" ? ATRtp : StratTP
STP= i_SLType == "Swing Lo/Hi" ? stp : i_SLType == "ATR Stop" ? ATRstp : StratSTP

//TrailingStop
dif=(valuewhen(strategy.position_size>0 and strategy.position_size[1]<=0, high,0))
 -strategy.position_avg_price
trailOffset     = strategy.position_avg_price - SL
var tstop = float(na)
if strategy.position_size > 0
    tstop := high- trailOffset - dif
    if tstop<tstop[1]
        tstop:=tstop[1]
else
    tstop := na
StrailOffset     = SSL - strategy.position_avg_price
var Ststop = float(na)
Sdif=strategy.position_avg_price-(valuewhen(strategy.position_size<0
 and strategy.position_size[1]>=0, low,0))
if strategy.position_size < 0
    Ststop := low+ StrailOffset + Sdif
    if Ststop>Ststop[1]
        Ststop:=Ststop[1]
else
    Ststop := na

strategy.exit("TP & SL", "long", limit=TP, stop=TS? tstop : SL, when=i_SL)
strategy.exit("TP & SL", "short", limit=STP, stop=TS? Ststop : SSL, when=i_SL)

/////////////////////// PLOTS //////////////////////////////////////////////////


plot(i_SL and strategy.position_size > 0 and not TS ? SL : i_SL and strategy.position_size > 0 and TS ? tstop : na , title='SL', style=plot.style_cross, color=color.red)
plot(i_SL and strategy.position_size < 0 and not TS ? SSL : i_SL and strategy.position_size < 0 and TS ? Ststop : na , title='SSL', style=plot.style_cross, color=color.red)
plot(i_SL and strategy.position_size > 0 ? TP : na, title='TP', style=plot.style_cross, color=color.green)
plot(i_SL and strategy.position_size < 0 ? STP : na, title='STP', style=plot.style_cross, color=color.green)
// Draw price action setup arrows
plotshape(BUY ? 1 : na, style=shape.triangleup, location=location.belowbar,
 color=color.green, title="Bullish Setup", size=size.auto)
plotshape(SELL ? 1 : na, style=shape.triangledown, location=location.abovebar,
 color=color.red, title="Bearish Setup", size=size.auto)