Strategi Pengembalian Santa Claus yang Dinamis
Ringkasan
Strategi Santa Claus Dynamic Reversal adalah strategi perdagangan kuantitatif untuk mengidentifikasi titik masuk dan keluar potensial berdasarkan hubungan reversal dinamis antara harga dan indeks pilar. Strategi ini menggunakan garis rata-rata dinamis parameter yang dapat disesuaikan dengan panjangnya, untuk memetakan garis tren reversal harga.
Prinsip Strategi
Inti dari strategi ini adalah menghitung hubungan regresi linier antara harga dan indeks pilar. Pertama, menghitung rata-rata bergerak sederhana dan kesenjangan standar dengan panjang N. Kemudian, berdasarkan faktor terkait sampel dan nilai kesenjangan standar, mencari kemiringan k dan intersection b dari garis regresi.
y = kx + b
Di mana, x adalah indeks kolom, y adalah harga.
Berdasarkan hubungan besarnya garis kemunduran saat ini dengan saat sebelumnya, menilai arah tren. Jika garis kemunduran naik dan harga tutup lebih tinggi dari harga buka dan harga tertinggi saat sebelumnya, maka dihasilkan sinyal beli; Jika garis kemunduran turun dan harga tutup lebih rendah dari harga buka dan harga terendah saat sebelumnya, maka dihasilkan sinyal jual.
Keunggulan Strategis
- Set parameter dinamis, yang dapat disesuaikan dengan perubahan harga dalam periode yang berbeda dengan menyesuaikan nilai N
- Hubungan regresi mempertimbangkan pengaruh faktor waktu, lebih mencerminkan tren harga
- Menggabungkan beberapa kriteria untuk menghasilkan sinyal perdagangan dan menghindari kesalahan
- Intuitif menunjukkan tren harga kembali, jelas dapat dibaca
Risiko dan Solusi
- Nilai N yang tidak tepat dapat menyebabkan garis regresi yang terlalu halus atau sensitif
- Solusi: menyesuaikan nilai N untuk menemukan titik keseimbangan optimal
- “Kalau tidak ada perubahan, maka tidak akan ada perubahan”, ujar dia.
- Solusi: Filter titik masuk dengan indikator lain
- Rasio lingkaran hanya mempertimbangkan satu titik waktu, mungkin melewatkan batas lokal
- Solusinya: Siapkan Jarak Relaksasi yang Tepat, Hindari Kesalahan Perhitungan
Arah optimasi
- Menambahkan mekanisme keluar yang dinamis, menyesuaikan stop loss sesuai dengan hubungan regresi
- Verifikasi sinyal dengan indikator seperti volume transaksi untuk mengurangi kesalahan transaksi
- Menggunakan metode pembelajaran mesin untuk mengoptimalkan parameter secara otomatis untuk lingkungan pasar yang lebih luas
- Menambahkan tampilan grafis untuk menampilkan hasil strategi secara lebih intuitif
Meringkaskan
Strategi Dinamis Santa Claus Returns memanfaatkan hubungan harga dan waktu yang dinamis, untuk mencapai sistem perdagangan kuantitatif yang fleksibel, intuitif, dan dapat disesuaikan dengan parameter. Strategi ini memiliki logika yang jelas dan mudah dipahami, dan dapat diterapkan pada produk dan siklus perdagangan yang berbeda melalui pengoptimalan parameter. Inovasi strategi ini adalah dengan memperkenalkan faktor waktu untuk membangun model dinamis, sehingga penilaian lebih cenderung.
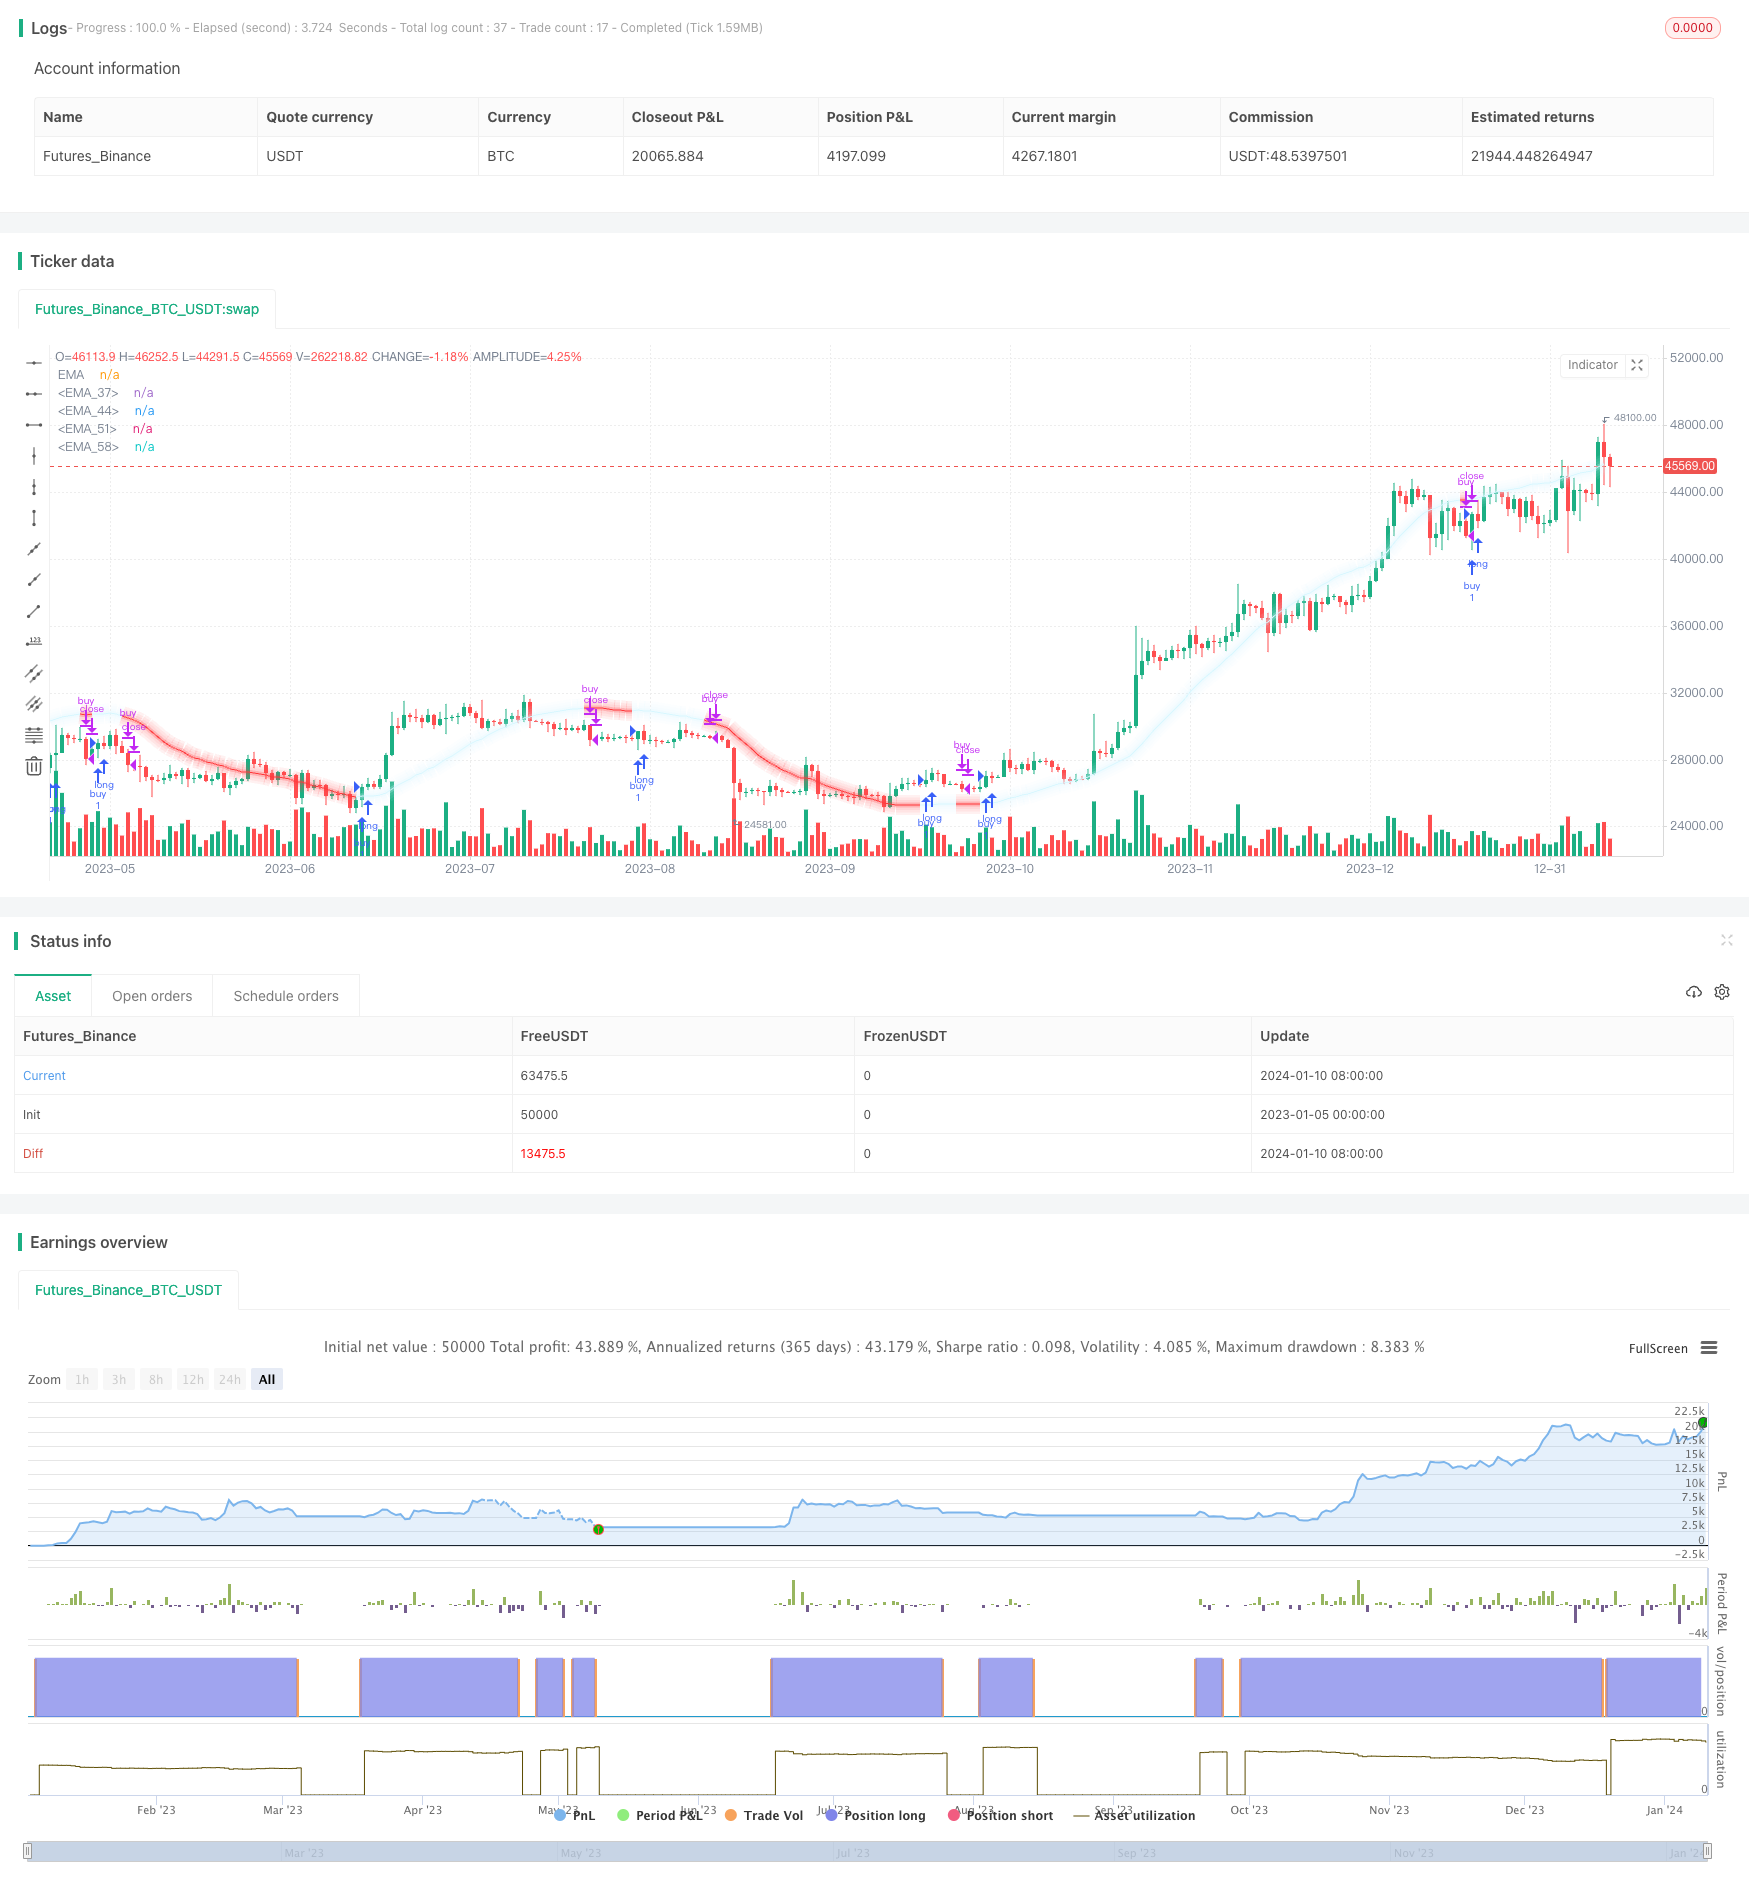
/*backtest
start: 2023-01-05 00:00:00
end: 2024-01-11 00:00:00
period: 1d
basePeriod: 1h
exchanges: [{"eid":"Futures_Binance","currency":"BTC_USDT"}]
*/

//@version=5
// Creator - TradeAI
strategy('Moving Santa Claus Strategy | TradeAI', overlay=true)

// Set the length of the moving average
length = input(64)

// Calculate the moving averages and standard deviations
x = bar_index
y = close
x_ = ta.sma(x, length)
y_ = ta.sma(y, length)
mx = ta.stdev(x, length)
my = ta.stdev(y, length)
c = ta.correlation(x, y, length)
slope = c * (my / mx)

// Calculate the parameters of the regression line
inter = y_ - slope * x_
reg = x * slope + inter

// Set the line color based on whether EMA is moving up or down
var color lineColor = na
if (reg > reg[1] and (close > open and close > high[1]))
    lineColor := color.new(#d8f7ff, 0)
if (reg < reg[1] and (close < open and close < low[1]))
    lineColor := color.new(#ff383b, 0)

// Plot the EMA line with different thicknesses
plot(reg, color=lineColor, title="EMA")

var color lineColorrr = na
if (reg > reg[1] and (close > open and close > high[1]))
    lineColorrr := color.new(#d8f7ff, 77)
if (reg < reg[1] and (close < open and close < low[1]))
    lineColorrr := color.new(#ff383b, 77)
plot(reg, color=lineColorrr, title="EMA", linewidth=5)

var color lineColorr = na
if (reg > reg[1] and (close > open and close > high[1]))
    lineColorr := color.new(#d8f7ff, 93)
if (reg < reg[1] and (close < open and close < low[1]))
    lineColorr := color.new(#ff383b, 93)
plot(reg, color=lineColorr, title="EMA", linewidth=10)

var color lineColorrrr = na
if (reg > reg[1] and (close > open and close > high[1]))
    lineColorrrr := color.new(#d8f7ff, 97)
if (reg < reg[1] and (close < open and close < low[1]))
    lineColorrrr := color.new(#ff383b, 97)
plot(reg, color=lineColorr, title="EMA", linewidth=15)

var color lineColorrrrr = na
if (reg > reg[1] and (close > open and close > high[1]))
    lineColorrrrr := color.new(#d8f7ff, 99)
if (reg < reg[1] and (close < open and close < low[1]))
    lineColorrrrr := color.new(#ff383b, 99)
plot(reg, color=lineColorr, title="EMA", linewidth=20)

// Implement trading strategy based on EMA direction
if reg > reg[1] and (close > open and close > high[1])
    strategy.entry('buy', strategy.long)

if reg < reg[1] and (close < open and close < low[1])
    strategy.close('buy')