Strategi perdagangan multi-kerangka waktu berdasarkan RSI dan rata-rata pergerakan
Ringkasan
Strategi ini menggabungkan indikator acak RSI, SMA bergerak, dan WMA bergerak berat untuk mencari sinyal beli dan jual. Strategi ini menilai arah tren pada waktu 5 menit dan 1 jam pada saat yang sama. Dalam tren yang stabil, sinyal perdagangan dihasilkan ketika RSI garis cepat melintasi atau melintasi garis lambat.
Prinsip Strategi
Strategi ini pertama-tama menghitung WMA dengan 144 periode dan SMA dengan 5 periode pada dua frame waktu, yaitu 1 jam dan 5 menit. Hanya ketika SMA 5 menit berada di atas WMA, maka dianggap sebagai pasar multihead. Kemudian strategi menghitung indikator polygon RSI, serta garis K dan garis D yang sesuai.
Analisis Keunggulan
Ini adalah strategi pelacakan tren yang sangat efektif. Ini menggabungkan dua tren penilaian kerangka waktu sekaligus, sangat efektif dalam mengurangi sinyal yang salah. Selain itu, ini menggabungkan beberapa indikator untuk memfilter, termasuk RSI, SMA dan WMA, untuk membuat sinyal lebih dapat diandalkan. Dengan membiarkan RSI menggerakkan KDJ, ini juga mengubah masalah sinyal palsu yang mudah terjadi dalam strategi KDJ biasa.
Analisis risiko
Risiko terbesar dari strategi ini adalah kesalahan dalam menilai tren. Pada titik pivot, rata-rata jangka pendek dan jangka panjang dapat naik atau turun secara bersamaan, sehingga menghasilkan sinyal yang salah. Selain itu, pada kondisi goyangan, RSI juga dapat menghasilkan sinyal perdagangan yang tidak jelas. Namun, risiko ini dapat dikurangi dengan menyesuaikan siklus SMA dan WMA serta parameter RSI dengan tepat.
Arah optimasi
Strategi ini dapat dioptimalkan dalam beberapa hal: 1) Uji SMA, WMA dan RSI dengan panjang yang berbeda untuk menemukan kombinasi parameter yang optimal 2) Menambahkan penilaian indikator lain, seperti MACD, Brinline, dan lain-lain untuk memverifikasi keandalan sinyal 3) Mengoptimalkan strategi stop loss, pengujian stop loss perorangan, stop loss saldo, dan tracking stop loss 4) Menambahkan modul manajemen dana untuk mengontrol skala investasi individu dan risiko keseluruhan 5) Menambahkan algoritma pembelajaran mesin untuk menemukan parameter yang berkinerja terbaik melalui banyak pengujian ulang
Meringkaskan
Strategi ini memanfaatkan keuntungan dari moving averages dan random indicators untuk membangun sistem pelacakan tren yang lebih andal. Dengan verifikasi beberapa frame waktu dan indikator, strategi ini berhasil menangkap arah tren garis tengah dan panjang. Selain itu, pengaturan stop loss juga membuatnya tahan terhadap beberapa guncangan pasar.
/*backtest
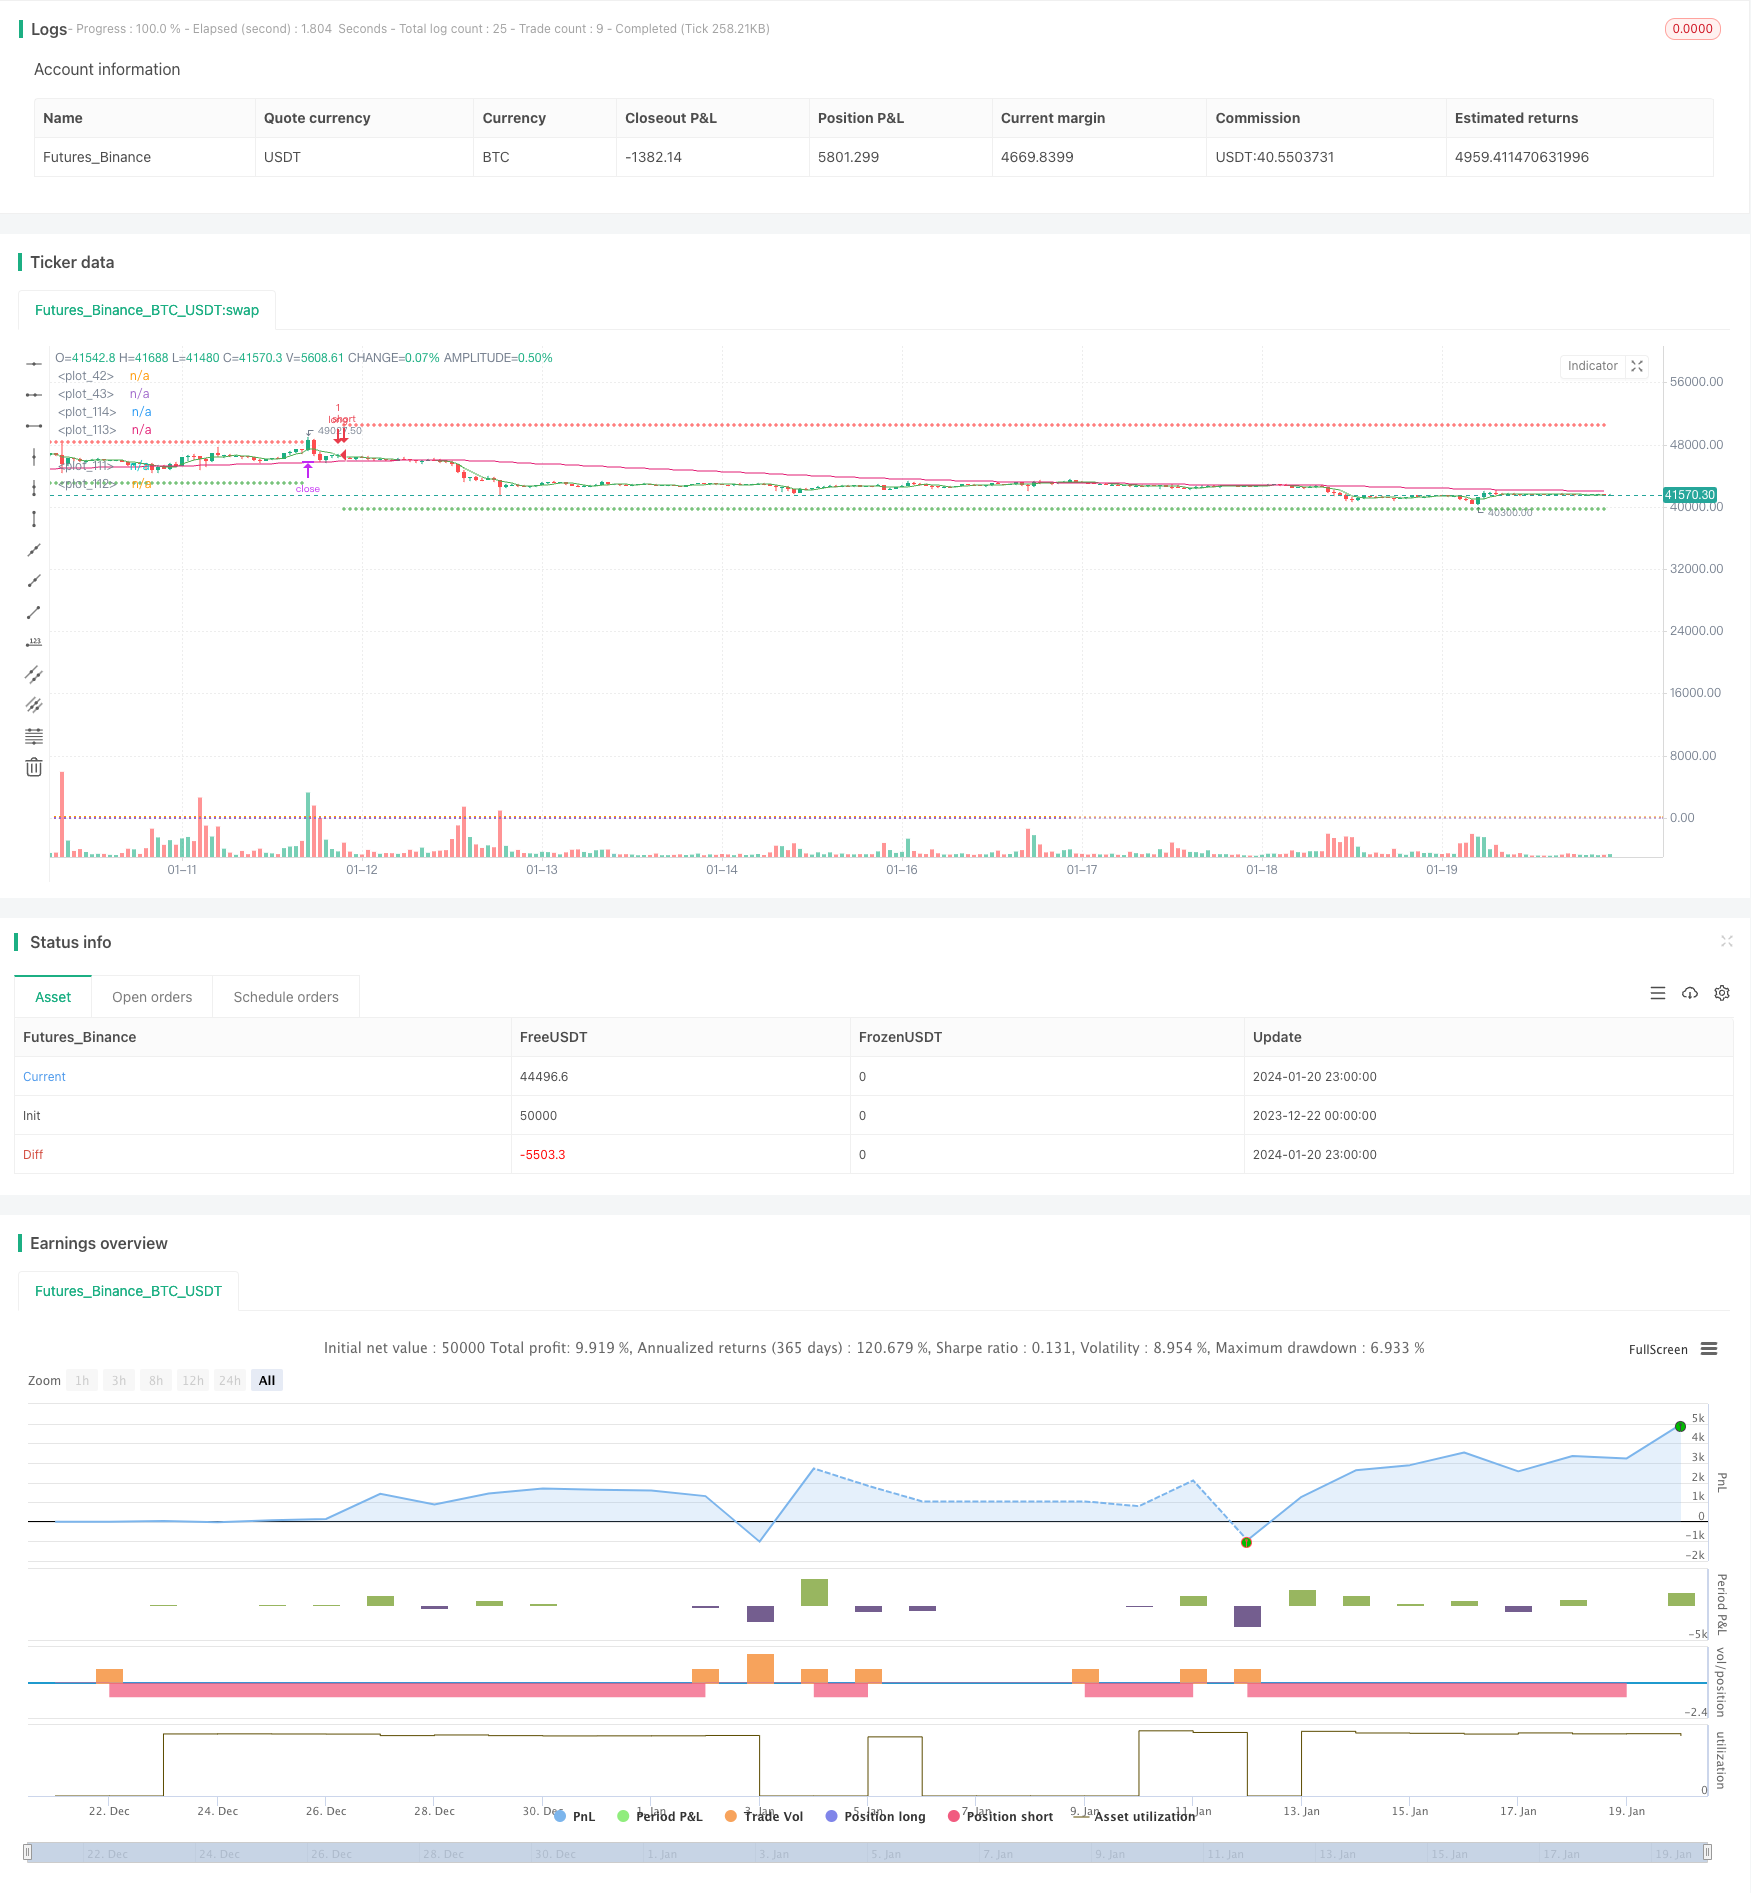
start: 2023-12-22 00:00:00
end: 2024-01-21 00:00:00
period: 1h
basePeriod: 15m
exchanges: [{"eid":"Futures_Binance","currency":"BTC_USDT"}]
*/
// This source code is subject to the terms of the Mozilla Public License 2.0 at https://mozilla.org/MPL/2.0/
// © bufirolas
// Works well with a wide stop with 20 bars lookback
// for the SL level and a 2:1 reward ratio Take Profit .
// These parameters can be modified in the Inputs section of the strategy panel.
// "an entry signal it's a cross down or up on
// the stochastics. if you're in a downtrend
// on the hourly time frame you
// must also be in a downtrend on the five
// minute so the five period has to be below the 144
// as long as the five period is still trading below
// the 144 period on both the hourly and the five minutes
// we are looking for these short signals crosses down
// in the overbought region of the stochastic. Viceversa for longs"
//@version=4
strategy("Stoch + WMA + SMA strat", overlay=true)
//SL & TP Inputs
i_SL=input(true, title="Use Swing Lo/Hi Stop Loss & Take Profit")
i_SwingLookback=input(20, title="Swing Lo/Hi Lookback")
i_SLExpander=input(defval=10, step=1, title="SL Expander")
i_TPExpander=input(defval=30, step=1, title="TP Expander")
i_reverse=input(false, title="Reverse Trades")
i_TStop =input(false, title="Use Trailing Stop")
//Strategy Inputs
src4 = input(close, title="RSI Source")
stochOS=input(defval=20, step=5, title="Stochastics Oversold Level")
stochOB=input(defval=80, step=5, title="Stochastics Overbought Level")
//Stoch rsi Calculations
smoothK = input(3, minval=1)
smoothD = input(3, minval=1)
lengthRSI = input(14, minval=1)
lengthStoch = input(14, minval=1)
rsi1 = rsi(src4, lengthRSI)
k = sma(stoch(rsi1, rsi1, rsi1, lengthStoch), smoothK)
d = sma(k, smoothD)
h0 = hline(80, linestyle=hline.style_dotted)
h1 = hline(20, linestyle=hline.style_dotted)
//MA
wmalen=input(defval=144, title="WMA Length")
WMA = security(syminfo.tickerid, "60", wma(close, wmalen))
SMA = security(syminfo.tickerid, "60", sma(close, 5))
minWMA = wma(close, wmalen)
minSMA = sma(close, 5)
//Entry Logic
stobuy = crossover(k, d) and k < stochOS
stosell = crossunder(k, d) and k > stochOB
mabuy = minSMA > minWMA
daymabuy = SMA > WMA
//SL & TP Calculations
SwingLow=lowest(i_SwingLookback)
SwingHigh=highest(i_SwingLookback)
bought=strategy.position_size != strategy.position_size[1]
LSL=valuewhen(bought, SwingLow, 0)-((valuewhen(bought, atr(14), 0)/5)*i_SLExpander)
SSL=valuewhen(bought, SwingHigh, 0)+((valuewhen(bought, atr(14), 0)/5)*i_SLExpander)
lTP=(strategy.position_avg_price + (strategy.position_avg_price-(valuewhen(bought, SwingLow, 0)))+((valuewhen(bought, atr(14), 0)/5)*i_TPExpander))
sTP=(strategy.position_avg_price - (valuewhen(bought, SwingHigh, 0) - strategy.position_avg_price))-((valuewhen(bought, atr(14), 0)/5)*i_TPExpander)
islong=strategy.position_size > 0
isshort=strategy.position_size < 0
//TrailingStop
dif=(valuewhen(strategy.position_size>0 and strategy.position_size[1]<=0, high,0))
-strategy.position_avg_price
trailOffset = strategy.position_avg_price - LSL
var tstop = float(na)
if strategy.position_size > 0
tstop := high- trailOffset - dif
if tstop<tstop[1]
tstop:=tstop[1]
else
tstop := na
StrailOffset = SSL - strategy.position_avg_price
var Ststop = float(na)
Sdif=strategy.position_avg_price-(valuewhen(strategy.position_size<0
and strategy.position_size[1]>=0, low,0))
if strategy.position_size < 0
Ststop := low+ StrailOffset + Sdif
if Ststop>Ststop[1]
Ststop:=Ststop[1]
else
Ststop := na
//Stop Selector
SL= islong ? LSL : isshort ? SSL : na
if i_TStop
SL:= islong ? tstop : isshort ? Ststop : na
TP= islong ? lTP : isshort ? sTP : na
//Entries
if stobuy and mabuy and daymabuy
strategy.entry("long", long=not i_reverse?true:false)
if stosell and not mabuy and not daymabuy
strategy.entry("short", long=not i_reverse?false:true)
//Exit
if i_SL
strategy.exit("longexit", "long", stop=SL, limit=TP)
strategy.exit("shortexit", "short", stop=SL, limit=TP)
//Plots
plot(i_SL ? SL : na, color=color.red, style=plot.style_cross)
plot(i_SL ? TP : na, color=color.green, style=plot.style_cross)
plot(minWMA)
plot(minSMA, color=color.green)