Strategi pelacakan momentum penyaringan rentang adaptif dua arah
Tanggal Pembuatan:
2024-01-24 11:31:51
Akhirnya memodifikasi:
2024-01-24 11:32:23
menyalin:
1
Jumlah klik:
705
1
fokus pada
1750
Pengikut
Ringkasan
Strategi ini adalah strategi pelacakan kuantitas variabel rentang yang disesuaikan secara bidirectional. Ini menggunakan filter rentang yang disesuaikan untuk melacak fluktuasi harga, dan menggabungkan indikator kuantitatif untuk menentukan arah nilai, untuk mencapai harga murah dan harga tinggi.
Prinsip Strategi
- Menggunakan filter rentang adaptif untuk melacak fluktuasi harga. Ukuran filter disesuaikan dengan periode, jumlah, dan skala rentang yang ditetapkan pengguna.
- Filter terbagi menjadi dua jenis yaitu Type 1 dan Type 2. Type 1 adalah tipe standar, dan Type 2 adalah tipe staircase.
- Arah fluktuasi harga ditentukan oleh hubungan ukuran filter dan harga penutupan. Harga di atas rel adalah bullish, di bawah rel adalah bearish.
- Dengan menggabungkan harga penutupan dengan penurunan hari sebelumnya, menentukan arah nilai. Nilai naik menjadi lebih tinggi, turun menjadi kosong.
- Sinyal beli dikirim saat harga menembus rel dan nilainya naik; Sinyal jual dikirim saat harga menembus rel dan nilainya turun
Analisis Keunggulan
- Adaptive Range Filter dapat menangkap fluktuasi pasar secara akurat.
- Kedua jenis filter dapat memenuhi preferensi perdagangan yang berbeda.
- Indikator kuantitatif gabungan dapat secara efektif mengidentifikasi arah nilai.
- Strategi yang fleksibel, dapat disesuaikan dengan parameter pasar.
- Customize Memilih kondisi transaksi yang sesuai dengan logika.
Analisis risiko
- Setting parameter yang tidak tepat dapat menyebabkan overtrading atau bocor.
- Ada keterlambatan dalam sinyal penembusan.
- Indikator energi kuantitatif memiliki risiko tertentu.
- Penembusan jangkauannya mudah dibodohkan.
Pengendalian risiko:
- Pilih kombinasi parameter yang tepat dan sesuaikan dengan kebutuhan.
- Tergabung dengan indikator lain untuk mengidentifikasi tren.
- Perdagangan dengan hati-hati di dekat titik kunci dan saat tren berbalik.
Arah optimasi
- Uji kombinasi parameter berbagai ukuran dan siklus kelancaran untuk menemukan kombinasi yang optimal.
- Cobalah berbagai jenis filter, pilih jenis yang Anda sukai.
- Uji indikator kuantitatif lainnya atau indikator teknis tambahan.
- Optimalkan dan sesuaikan logika kondisi transaksi untuk mengurangi transaksi yang tidak rasional.
- Tergabung dengan teori market segmentation untuk menetapkan rasio adjustment swap.
Kode Sumber Strategi
/*backtest
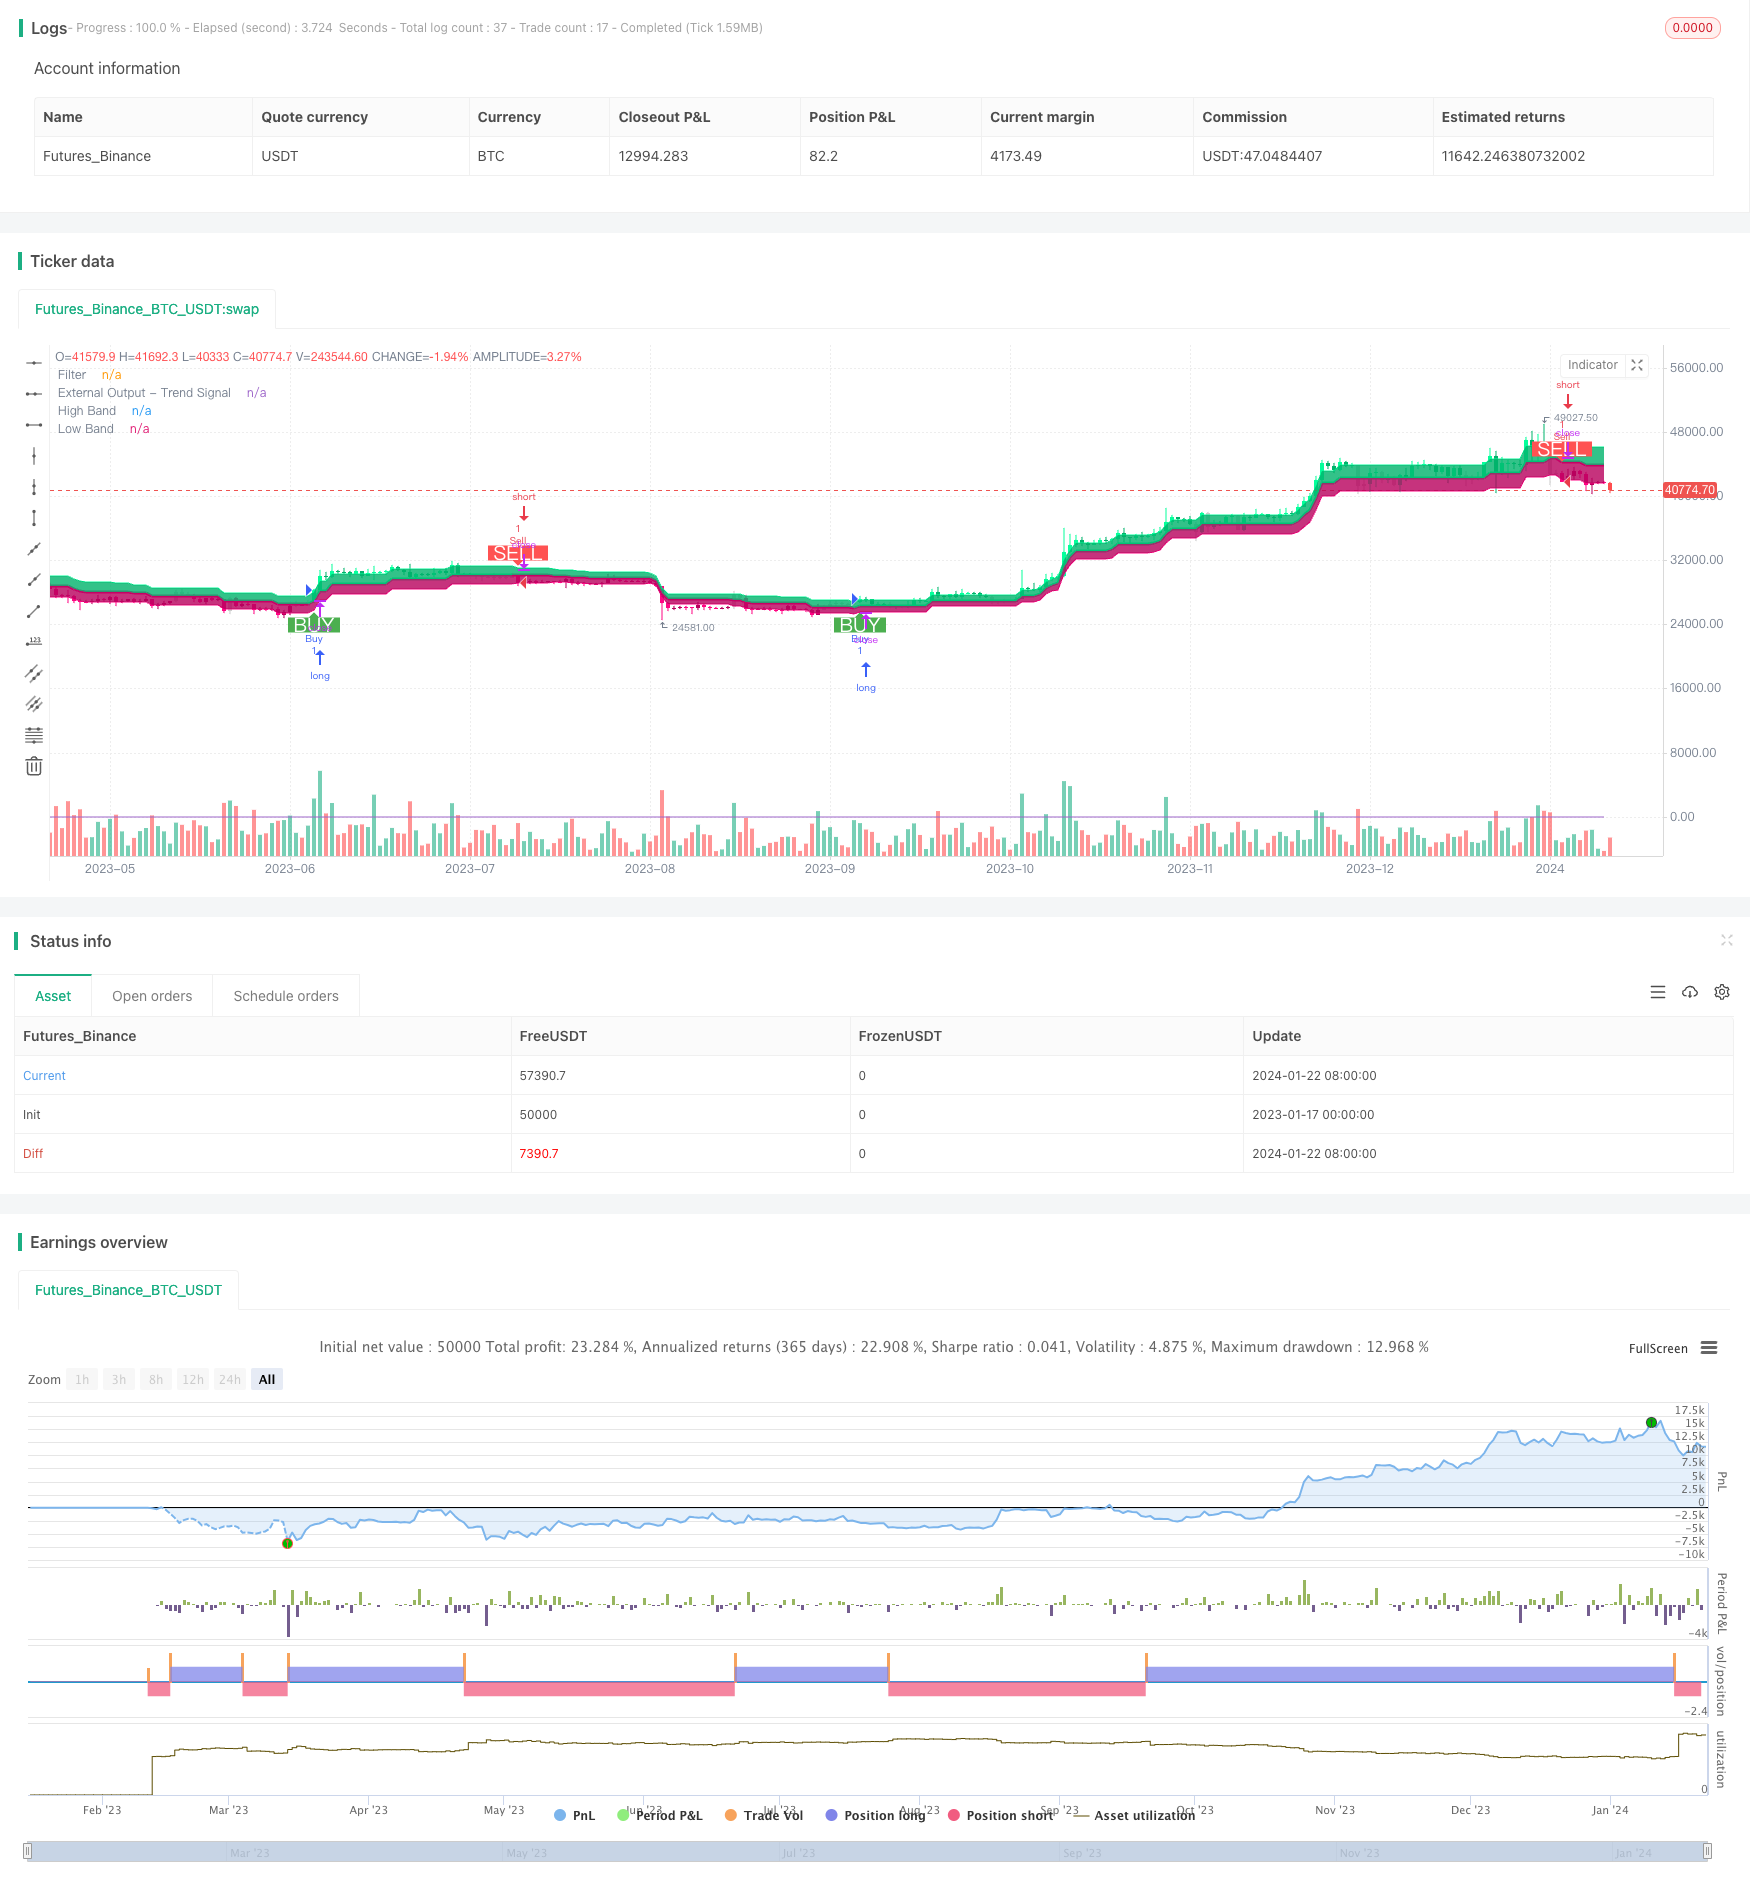
start: 2023-01-17 00:00:00
end: 2024-01-23 00:00:00
period: 1d
basePeriod: 1h
exchanges: [{"eid":"Futures_Binance","currency":"BTC_USDT"}]
*/
//@version=4
strategy("Range Filter [DW] & Labels", shorttitle="RF [DW] & Labels", overlay=true)
//Conditional Sampling EMA Function
Cond_EMA(x, cond, n)=>
var val = array.new_float(0)
var ema_val = array.new_float(1)
if cond
array.push(val, x)
if array.size(val) > 1
array.remove(val, 0)
if na(array.get(ema_val, 0))
array.fill(ema_val, array.get(val, 0))
array.set(ema_val, 0, (array.get(val, 0) - array.get(ema_val, 0))*(2/(n + 1)) + array.get(ema_val, 0))
EMA = array.get(ema_val, 0)
EMA
//Conditional Sampling SMA Function
Cond_SMA(x, cond, n)=>
var vals = array.new_float(0)
if cond
array.push(vals, x)
if array.size(vals) > n
array.remove(vals, 0)
SMA = array.avg(vals)
SMA
//Standard Deviation Function
Stdev(x, n)=>
sqrt(Cond_SMA(pow(x, 2), 1, n) - pow(Cond_SMA(x, 1, n), 2))
//Range Size Function
rng_size(x, scale, qty, n)=>
ATR = Cond_EMA(tr(true), 1, n)
AC = Cond_EMA(abs(x - x[1]), 1, n)
SD = Stdev(x, n)
rng_size = scale=="Pips" ? qty*0.0001 : scale=="Points" ? qty*syminfo.pointvalue : scale=="% of Price" ? close*qty/100 : scale=="ATR" ? qty*ATR :
scale=="Average Change" ? qty*AC : scale=="Standard Deviation" ? qty*SD : scale=="Ticks" ? qty*syminfo.mintick : qty
//Two Type Range Filter Function
rng_filt(h, l, rng_, n, type, smooth, sn, av_rf, av_n)=>
rng_smooth = Cond_EMA(rng_, 1, sn)
r = smooth ? rng_smooth : rng_
var rfilt = array.new_float(2, (h + l)/2)
array.set(rfilt, 1, array.get(rfilt, 0))
if type=="Type 1"
if h - r > array.get(rfilt, 1)
array.set(rfilt, 0, h - r)
if l + r < array.get(rfilt, 1)
array.set(rfilt, 0, l + r)
if type=="Type 2"
if h >= array.get(rfilt, 1) + r
array.set(rfilt, 0, array.get(rfilt, 1) + floor(abs(h - array.get(rfilt, 1))/r)*r)
if l <= array.get(rfilt, 1) - r
array.set(rfilt, 0, array.get(rfilt, 1) - floor(abs(l - array.get(rfilt, 1))/r)*r)
rng_filt1 = array.get(rfilt, 0)
hi_band1 = rng_filt1 + r
lo_band1 = rng_filt1 - r
rng_filt2 = Cond_EMA(rng_filt1, rng_filt1 != rng_filt1[1], av_n)
hi_band2 = Cond_EMA(hi_band1, rng_filt1 != rng_filt1[1], av_n)
lo_band2 = Cond_EMA(lo_band1, rng_filt1 != rng_filt1[1], av_n)
rng_filt = av_rf ? rng_filt2 : rng_filt1
hi_band = av_rf ? hi_band2 : hi_band1
lo_band = av_rf ? lo_band2 : lo_band1
[hi_band, lo_band, rng_filt]
//-----------------------------------------------------------------------------------------------------------------------------------------------------------------
//Inputs
//-----------------------------------------------------------------------------------------------------------------------------------------------------------------
//Filter Type
f_type = input(defval="Type 1", options=["Type 1", "Type 2"], title="Filter Type")
//Movement Source
mov_src = input(defval="Close", options=["Wicks", "Close"], title="Movement Source")
//Range Size Inputs
rng_qty = input(defval=2.618, minval=0.0000001, title="Range Size")
rng_scale = input(defval="Average Change", options=["Points", "Pips", "Ticks", "% of Price", "ATR", "Average Change", "Standard Deviation", "Absolute"], title="Range Scale")
//Range Period
rng_per = input(defval=14, minval=1, title="Range Period (for ATR, Average Change, and Standard Deviation)")
//Range Smoothing Inputs
smooth_range = input(defval=true, title="Smooth Range")
smooth_per = input(defval=27, minval=1, title="Smoothing Period")
//Filter Value Averaging Inputs
av_vals = input(defval=true, title="Average Filter Changes")
av_samples = input(defval=2, minval=1, title="Number Of Changes To Average")
//-----------------------------------------------------------------------------------------------------------------------------------------------------------------
//Definitions
//-----------------------------------------------------------------------------------------------------------------------------------------------------------------
//High And Low Values
h_val = mov_src=="Wicks" ? high : close
l_val = mov_src=="Wicks" ? low : close
//Range Filter Values
[h_band, l_band, filt] = rng_filt(h_val, l_val, rng_size((h_val + l_val)/2, rng_scale, rng_qty, rng_per), rng_per, f_type, smooth_range, smooth_per, av_vals, av_samples)
//Direction Conditions
var fdir = 0.0
fdir := filt > filt[1] ? 1 : filt < filt[1] ? -1 : fdir
upward = fdir==1 ? 1 : 0
downward = fdir==-1 ? 1 : 0
//Colors
filt_color = upward ? #05ff9b : downward ? #ff0583 : #cccccc
bar_color = upward and (close > filt) ? (close > close[1] ? #05ff9b : #00b36b) :
downward and (close < filt) ? (close < close[1] ? #ff0583 : #b8005d) : #cccccc
//-----------------------------------------------------------------------------------------------------------------------------------------------------------------
//Outputs
//-----------------------------------------------------------------------------------------------------------------------------------------------------------------
//Filter Plot
filt_plot = plot(filt, color=filt_color, transp=0, linewidth=3, title="Filter")
//Band Plots
h_band_plot = plot(h_band, color=#05ff9b, transp=100, title="High Band")
l_band_plot = plot(l_band, color=#ff0583, transp=100, title="Low Band")
//Band Fills
fill(h_band_plot, filt_plot, color=#00b36b, transp=85, title="High Band Fill")
fill(l_band_plot, filt_plot, color=#b8005d, transp=85, title="Low Band Fill")
//Bar Color
barcolor(bar_color)
//External Trend Output
plot(fdir, transp=100, editable=false, display=display.none, title="External Output - Trend Signal")
// Trading Conditions Logic
longCond = close > filt and close > close[1] and upward > 0 or close > filt and close < close[1] and upward > 0
shortCond = close < filt and close < close[1] and downward > 0 or close < filt and close > close[1] and downward > 0
CondIni = 0
CondIni := longCond ? 1 : shortCond ? -1 : CondIni[1]
longCondition = longCond and CondIni[1] == -1
shortCondition = shortCond and CondIni[1] == 1
// Strategy Entry and Exit
strategy.entry("Buy", strategy.long, when = longCondition)
strategy.entry("Sell", strategy.short, when = shortCondition)
strategy.close("Buy", when = shortCondition)
strategy.close("Sell", when = longCondition)
// Plot Buy and Sell Labels
plotshape(longCondition, title = "Buy Signal", text ="BUY", textcolor = color.white, style=shape.labelup, size = size.normal, location=location.belowbar, color = color.green, transp = 0)
plotshape(shortCondition, title = "Sell Signal", text ="SELL", textcolor = color.white, style=shape.labeldown, size = size.normal, location=location.abovebar, color = color.red, transp = 0)
// Alerts
alertcondition(longCondition, title="Buy Alert", message = "BUY")
alertcondition(shortCondition, title="Sell Alert", message = "SELL")