Strategi perdagangan emas berdasarkan momentum dan deviasi standar
Ringkasan
Strategi ini menilai overbought dan oversold di pasar dengan menghitung deviasi harga emas dari rata-rata pergerakan indeks 21 hari, digabungkan dengan standar deviasi, dan mengambil strategi pelacakan tren ketika deviasi mencapai standar deviasi tertentu, sambil mengatur mekanisme stop loss untuk mengendalikan risiko.
Prinsip Strategi
- Hitung rata-rata pergerakan indeks 21 hari sebagai sumbu tengah
- Perhitungan deviasi harga emas dari rata-rata bergerak
- Standarisasi deviasi, konversi ke Z-Score
- Ketika Z-Score di atas 0,5, lakukan lebih banyak; ketika Z-Score di bawah -0,5, lakukan kosong
- Z-Score kembali ke titik terendah 0.5/-0.5 dan posisi kosong
- Z-Score lebih dari 3⁄3, stop loss
Analisis Keunggulan
Ini adalah strategi pelacakan tren yang mendasari overbought dan oversold pasar berdasarkan pergerakan harga dan standar deviasi, dengan keuntungan sebagai berikut:
- Menggunakan moving average sebagai support/resistance dinamis untuk menangkap tren
- Skala standar dan skor Z sangat baik untuk menilai overbought dan oversold, mengurangi sinyal palsu.
- Dengan menggunakan indeks moving average, lebih banyak pengaruh terhadap harga baru-baru ini dan lebih sensitif
- Z-Score menstandarisasi deviasi harga, membuat aturan penilaian lebih seragam
- Menetapkan mekanisme stop loss, yang dapat menghentikan kerugian tepat waktu, mengendalikan risiko
Analisis risiko
Strategi ini juga memiliki beberapa risiko:
- Rata-rata bergerak sebagai acuan untuk menilai, memberikan sinyal yang salah ketika harga terlihat melompat atau menerobos
- Standar deviasi dan Z-Score penilaian ambang batas perlu diatur dengan tepat, terlalu besar atau terlalu kecil akan mempengaruhi kinerja strategi
- Pengaturan Stop Loss yang tidak tepat, mungkin terlalu radikal, menyebabkan kerugian yang tidak perlu
- Kejadian-kejadian mendadak menyebabkan harga turun naik secara signifikan, yang dapat memicu stop loss dan kehilangan peluang tren.
Solusi:
- Pengaturan parameter rata-rata bergerak yang masuk akal, identifikasi tren utama
- Temukan titik terendah optimal dengan mengevaluasi parameter standar deviasi optimasi
- Setting Trailing Stop loss checking policy to stop loss reasonableness
- Evaluasi kembali kondisi pasar yang tepat waktu setelah insiden tersebut dan penyesuaian parameter strategi
Arah optimasi
Strategi ini dapat dioptimalkan dalam beberapa hal:
- Indikator volatilitas seperti ATR dapat digunakan untuk menentukan selera risiko yang lebih baik daripada standar deviasi sederhana.
- Cobalah berbagai jenis moving average untuk mencari indikator yang lebih cocok di sumbu tengah
- Mengoptimalkan parameter moving average, Identify optimal averaging period
- Mengoptimalkan ambang batas Z-Score, mencari parameter kinerja strategi terbaik
- Menambahkan Stop Loss Berbasis Volatilitas, Membuat Stop Loss Lebih Cerdas dan Rasional
Meringkaskan
Strategi ini secara keseluruhan adalah strategi pelacakan tren yang masuk akal. Ini menggunakan rata-rata bergerak untuk menentukan arah tren utama, dan dengan pengolahan standar deviasi harga, dapat dengan jelas menilai kondisi overbought dan oversold di pasar, sehingga menghasilkan sinyal perdagangan. Mengatur cara stop loss yang masuk akal juga memungkinkan strategi untuk mengendalikan risiko sambil menjamin keuntungan.
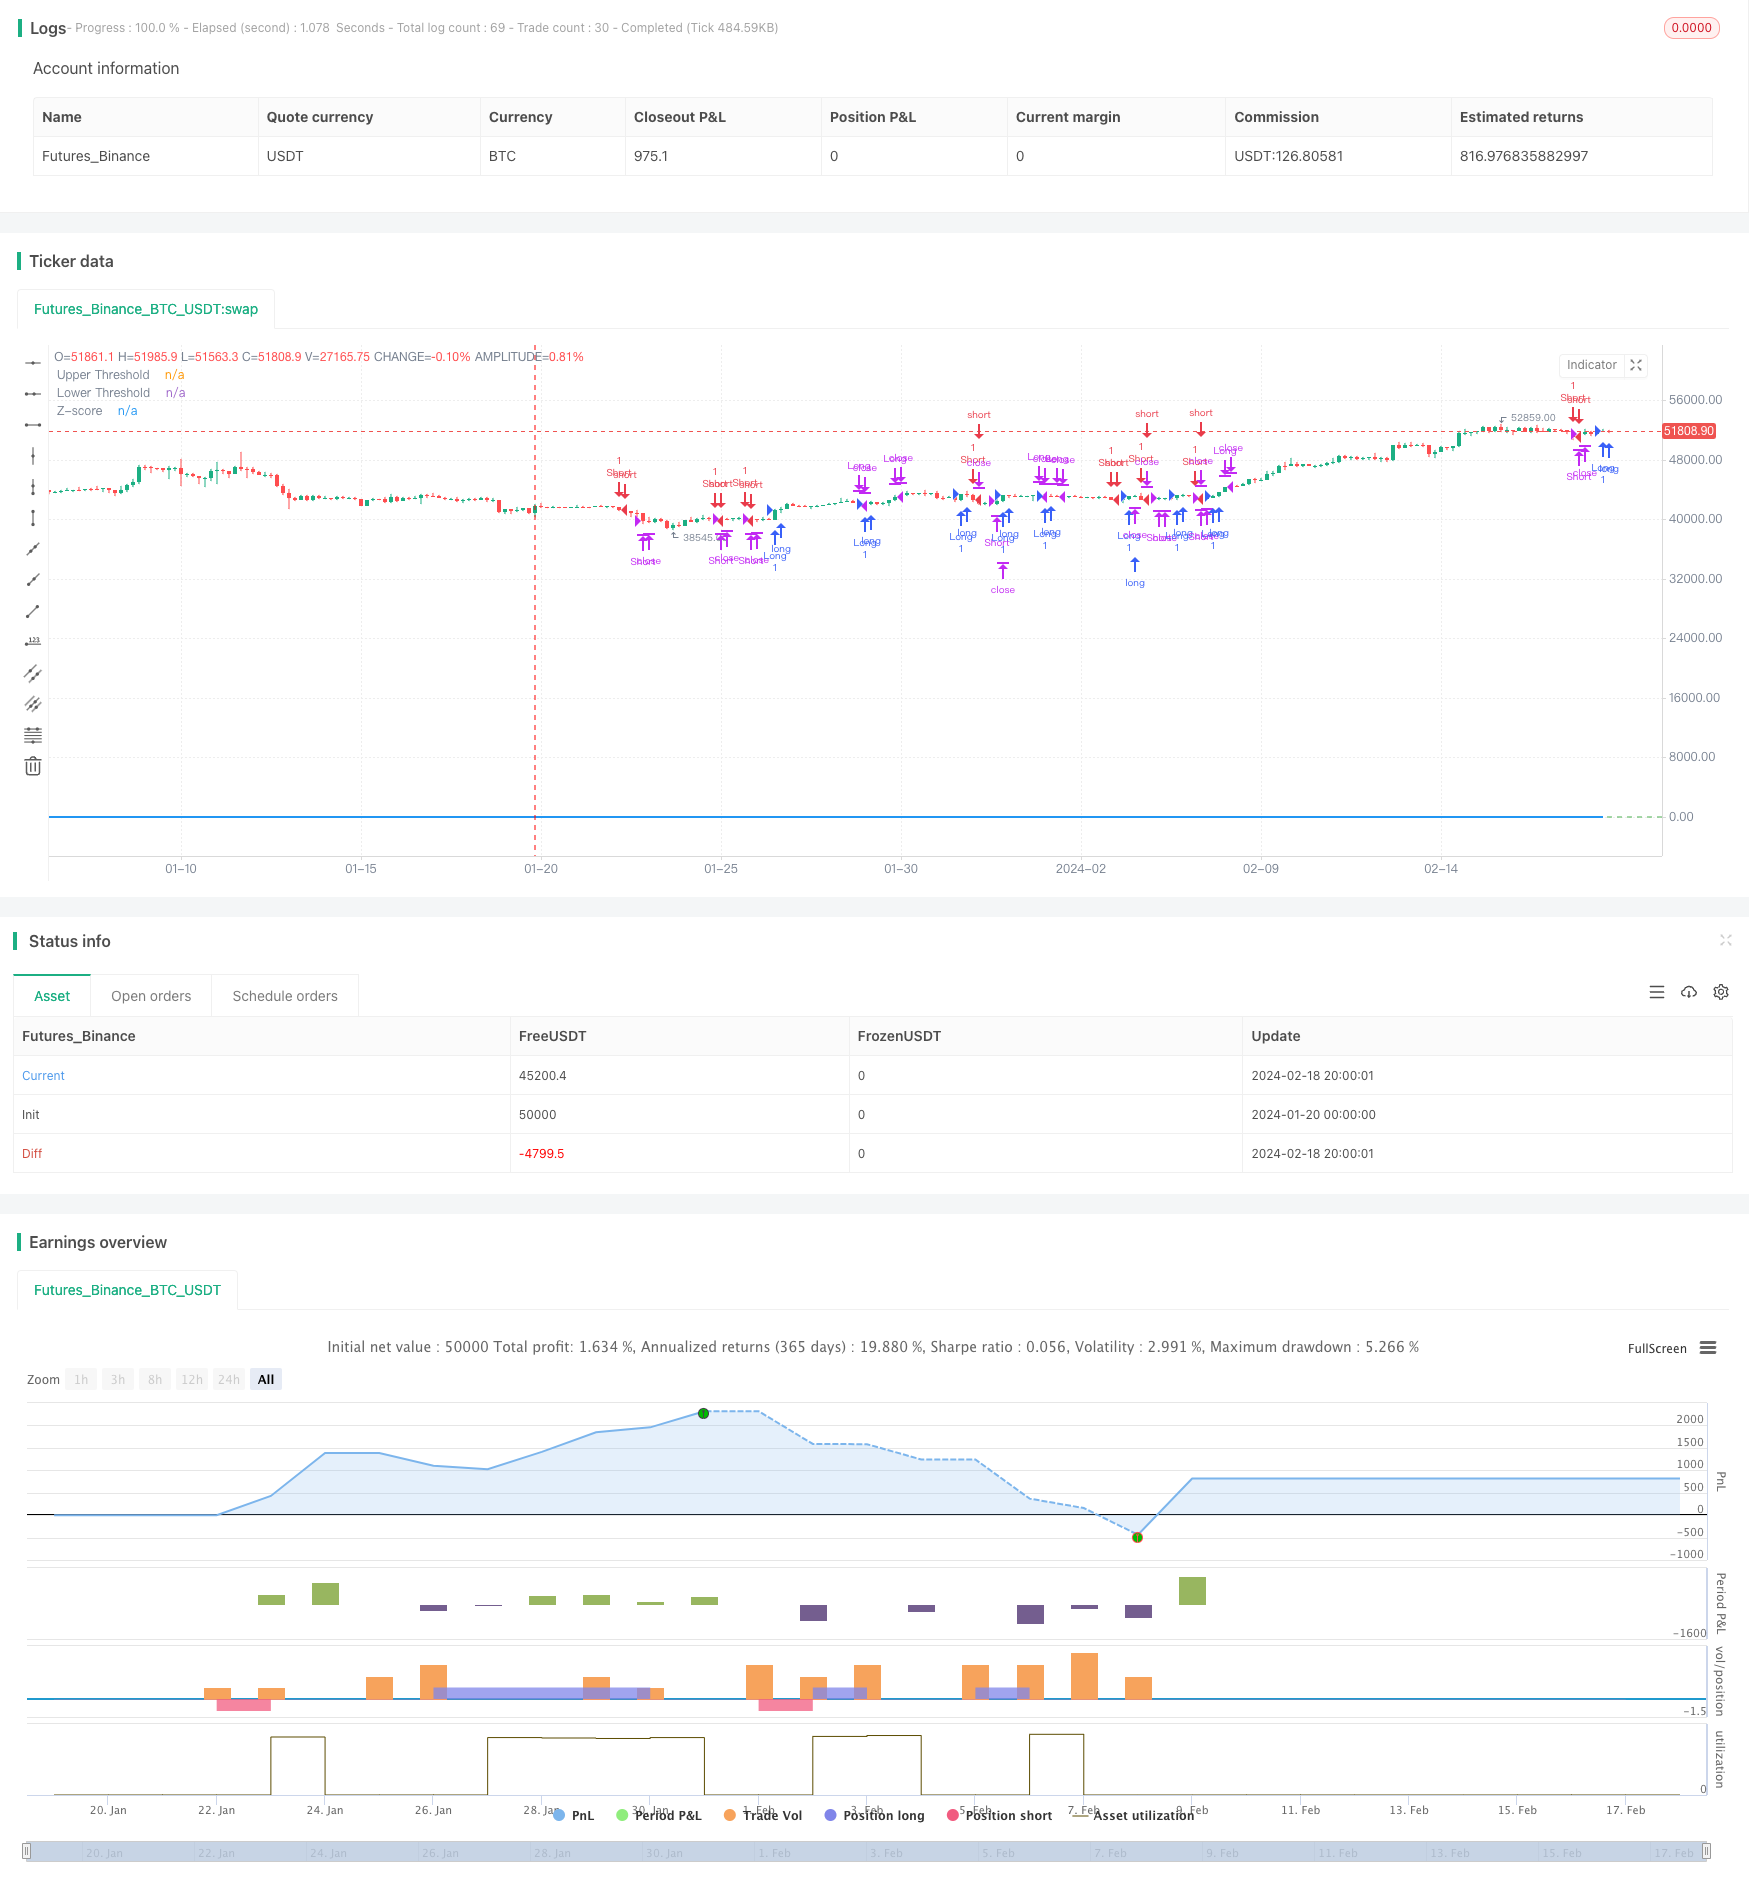
/*backtest
start: 2024-01-20 00:00:00
end: 2024-02-19 00:00:00
period: 4h
basePeriod: 15m
exchanges: [{"eid":"Futures_Binance","currency":"BTC_USDT"}]
*/

//@version=5
strategy("GC Momentum Strategy with Stoploss and Limits", overlay=true)

// Input for the length of the EMA
ema_length = input.int(21, title="EMA Length", minval=1)

// Exponential function parameters
steepness = 2

// Calculate the EMA
ema = ta.ema(close, ema_length)

// Calculate the deviation of the close price from the EMA
deviation = close - ema

// Calculate the standard deviation of the deviation
std_dev = ta.stdev(deviation, ema_length)

// Calculate the Z-score
z_score = deviation / std_dev

// Long entry condition if Z-score crosses +0.5 and is below 3 standard deviations
long_condition = ta.crossover(z_score, 0.5)

// Short entry condition if Z-score crosses -0.5 and is above -3 standard deviations
short_condition = ta.crossunder(z_score, -0.5)

// Exit long position if Z-score converges below 0.5 from top
exit_long_condition = ta.crossunder(z_score, 0.5)

// Exit short position if Z-score converges above -0.5 from below
exit_short_condition = ta.crossover(z_score, -0.5)

// Stop loss condition if Z-score crosses above 3 or below -3
stop_loss_long = ta.crossover(z_score, 3)
stop_loss_short = ta.crossunder(z_score, -3)

// Enter and exit positions based on conditions
if (long_condition)
    strategy.entry("Long", strategy.long)
if (short_condition)
    strategy.entry("Short", strategy.short)
if (exit_long_condition)
    strategy.close("Long")
if (exit_short_condition)
    strategy.close("Short")
if (stop_loss_long)
    strategy.close("Long")
if (stop_loss_short)
    strategy.close("Short")

// Plot the Z-score on the chart
plot(z_score, title="Z-score", color=color.blue, linewidth=2)

// Optional: Plot zero lines for reference
hline(0.5, "Upper Threshold", color=color.red)
hline(-0.5, "Lower Threshold", color=color.green)