Ichimoku Kinko Hyo + Strategi Kuantitatif Superposisi Tren Pergeseran
Ringkasan
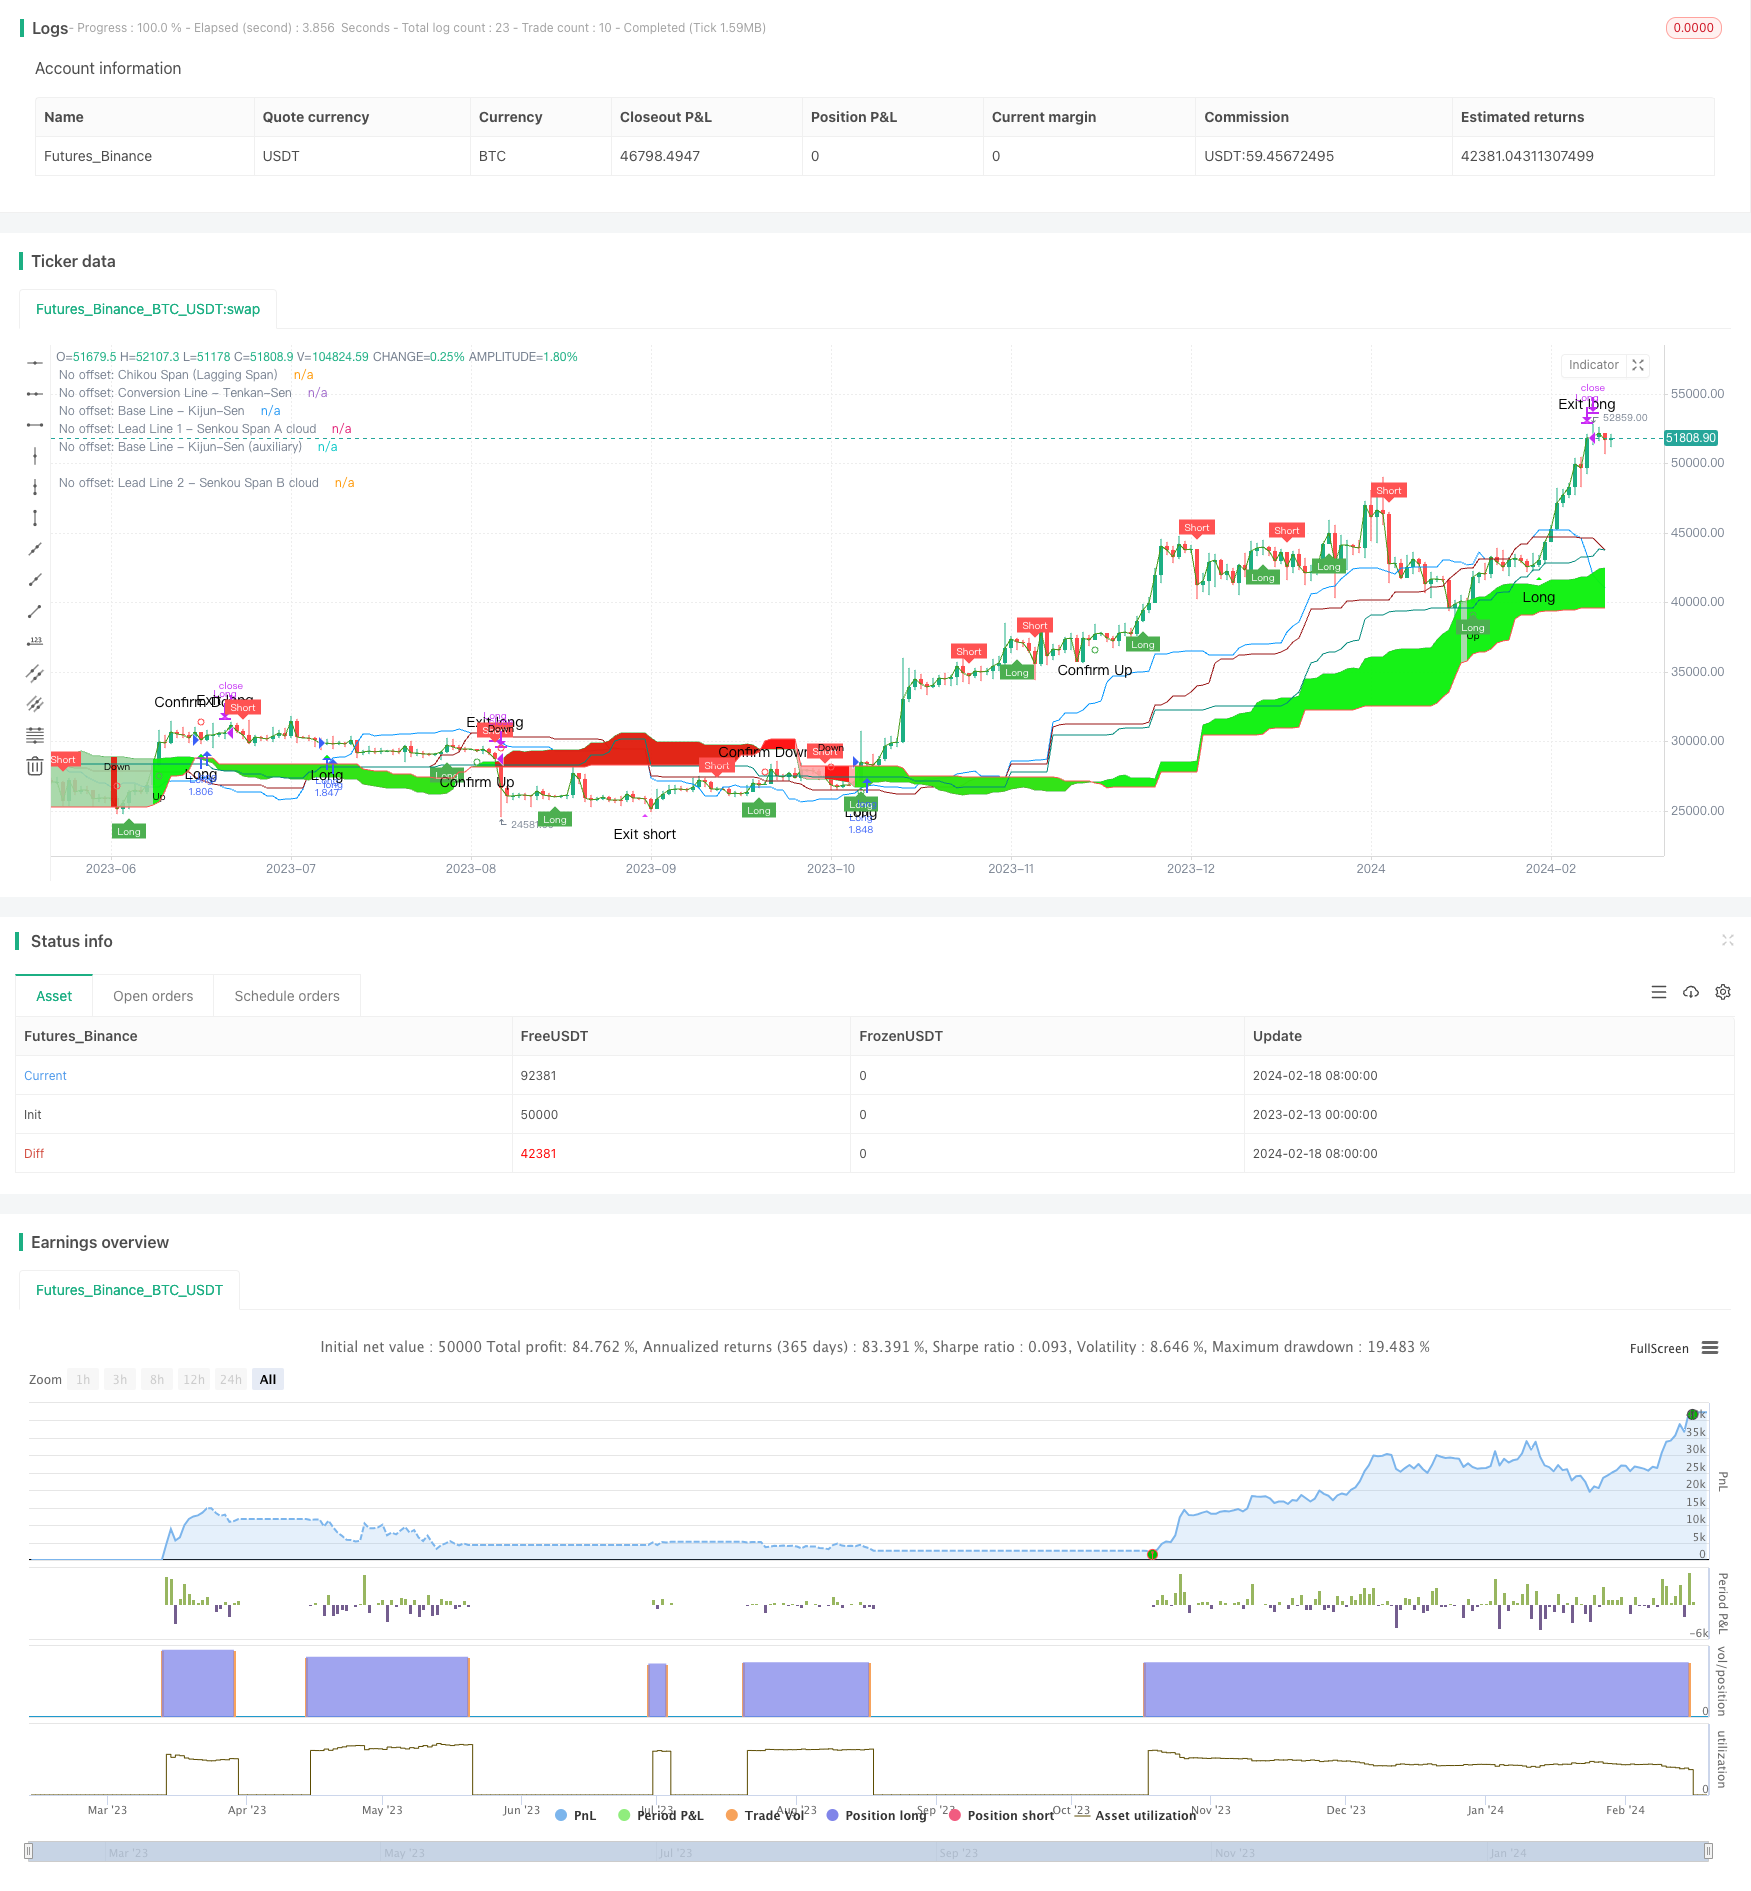
Strategi ini merupakan kombinasi dari indikator keseimbangan pertama dan indikator overlay bergerak untuk menemukan tren potensial dalam harga saham dan menentukan waktu untuk membeli dan menjual. Strategi ini dengan menghitung garis keseimbangan pertama, dikombinasikan dengan indikator overlay bergerak untuk menentukan arah tren dan mengirimkan sinyal perdagangan, sementara menggunakan indikator RSI untuk memfilter untuk mengendalikan risiko perdagangan.
Prinsip Strategi
Strategi ini terdiri dari tiga bagian utama:
Indikator keseimbangan pertama mata: Indikator keseimbangan pertama mata terutama menggunakan titik pivot ((Tenkan-Sen) dan titik dasar ((Kijun-sen) yang terdiri dari dua garis, yang membentuk bentuk yang seimbang pada pandangan pertama. Garis titik pivot mewakili tren jangka pendek harga, dan garis titik dasar mewakili tren jangka menengah harga. Garis titik pivot dan persilangan garis titik dasar membentuk sinyal beli dan jual.
Indikator overlap gerak: Indikator overlap gerak menilai arah tren dengan menghitung band antara nilai relasi yang terpisah dan nilai relasi yang tergelincir. Sinyal perdagangan dihasilkan ketika harga masuk dari band luar ke band tengah.
Indikator RSI: Indikator RSI digunakan untuk menentukan apakah harga oversold atau oversold, mengatur batas overbought dan oversold, dan bersama-sama dengan sinyal perdagangan yang digabungkan dengan indikator overbought bergerak untuk menentukan sinyal beli dan jual.
Secara khusus, strategi ini akan memantau apakah garis titik bergeser dan garis titik acuan terjadi dalam bentuk garpu emas (yang melintasi garis titik acuan di atas garis titik acuan) dan garpu mati (yang melintasi garis titik acuan di bawah garis titik acuan) untuk menentukan kapan membeli dan menjual. Di samping itu, kombinasi indikator overlay bergerak untuk menentukan arah tren secara keseluruhan. Ketika kedua indikator mengirimkan sinyal secara bersamaan, sinyal perdagangan dikirim jika indikator RSI menunjukkan tidak ada overbought atau oversold.
Keunggulan Strategis
Strategi ini dikombinasikan dengan penggunaan berbagai indikator untuk menentukan arah tren dan waktu perdagangan, dapat meningkatkan akurasi penilaian, memanfaatkan keunggulan komplementer antara indikator, dan menghindari kemungkinan kesalahan dalam penilaian indikator tunggal. Keunggulan spesifiknya adalah sebagai berikut:
Menggunakan garis titik pivot dan garis titik acuan untuk membentuk indikator keseimbangan pertama, dapat mencerminkan tren jangka pendek dan tren jangka menengah, dengan akurasi yang lebih tinggi daripada indikator MA tunggal.
Indikator superimposisi gerak akurat dan dapat diandalkan untuk menentukan arah tren secara keseluruhan, dan saling melengkapi dengan indikator kesetimbangan sekilas.
Indikator RSI menetapkan kondisi filter yang efektif untuk memfilter false breakout dan menghindari risiko perdagangan.
Strategi ini mudah dimengerti dan diimplementasikan untuk transaksi kuantitatif.
Risiko Strategis
Meskipun strategi ini menggunakan beberapa indikator untuk penilaian yang berkolaborasi, dapat mengurangi kemungkinan kesalahan penilaian, risiko utama yang ada adalah:
Pengaturan parameter berisiko. Pengaturan parameter indikator yang tidak tepat seperti garis titik pivot, garis titik acuan, dan lain-lain akan menyebabkan kesalahan sinyal perdagangan.
Risiko pembalikan tren. Dalam situasi konsolidasi, sinyal palsu dapat dihasilkan. Perlu digabungkan dengan lebih banyak indikator untuk menilai sinyal pembalikan tren.
Risiko kondisi penyaringan RSI yang terlalu ketat. Mungkin lebih banyak peluang perdagangan yang terbuang. Parameter RSI dapat dilepaskan dengan tepat.
Solusi yang sesuai:
Optimalkan parameter untuk varietas yang berbeda dengan menggunakan lebih banyak data historis untuk memastikan pengaturan parameter yang masuk akal.
Menambahkan mekanisme stop loss ke dalam strategi. Keluar dari posisi ketika harga menerobos garis stop loss ke arah yang berlawanan.
Mengoptimalkan parameter RSI, meredakan kondisi penyaringan dengan tepat, dan mendapatkan lebih banyak peluang perdagangan dengan asumsi pengendalian risiko.
Arah optimasi strategi
Strategi ini juga dapat terus dioptimalkan:
Menambahkan algoritma pembelajaran mesin untuk membuat parameter strategi beradaptasi secara dinamis dengan perubahan pasar, meningkatkan adaptasi strategi.
Membungkus komponen strategi menjadi modul, untuk manajemen modular, untuk memudahkan penggantian komponen dengan cepat atau mengoptimalkan komponen yang diuji secara terpisah, meningkatkan efisiensi pengembangan.
Menambahkan modul integrasi data, mendapatkan data pasar dari lebih banyak sumber data, membentuk set pelatihan berkualitas tinggi, meningkatkan efek pembelajaran mesin.
Pengembangan alat pengembalian untuk pengembalian strategi secara menyeluruh, mencatat berbagai indikator penilaian, penyesuaian parameter yang dioptimalkan dan pilihan model.
Menggunakan platform komputasi awan untuk mengimplementasikan sistem strategi, memanfaatkan sumber daya komputasi yang fleksibel untuk melakukan retrospeksi paralel yang cepat, mempercepat iterasi optimasi parameter, dan mengurangi biaya pengembangan strategi.
Meringkaskan
Strategi ini menggunakan indikator keseimbangan pertama dan indikator overlay bergerak dua indikator untuk bekerja sama, saling melengkapi menentukan tren harga dan waktu perdagangan. Sementara menggunakan indikator RSI untuk memfilter dan mengendalikan risiko perdagangan. Bentuk strategi kombinasi multi-indikator ini dapat meningkatkan akurasi penilaian dan mendapatkan efek strategi yang lebih baik. Namun, pengaturan parameter dan pilihan indikator dalam strategi masih perlu terus diuji dan dioptimalkan untuk berbagai varietas, untuk menyesuaikan parameter strategi dan memilih indikator masih perlu diuji dan dioptimalkan untuk berbagai produk, sehingga strategi dapat beradaptasi dengan cepat dengan perubahan pasar dan memiliki kemampuan profitabilitas yang tahan lama.
/*backtest
start: 2023-02-13 00:00:00
end: 2024-02-19 00:00:00
period: 1d
basePeriod: 1h
exchanges: [{"eid":"Futures_Binance","currency":"BTC_USDT"}]
*/

// This source code is subject to the terms of the Mozilla Public License 2.0 at https://mozilla.org/MPL/2.0/
// © KryptoNight

//@version=4
// comment/uncomment Study/Strategy to easily switch modes
// study("Ichimoku Kinko Hyo Cloud - no offset - no repaint - RSI filter - alerts", shorttitle="IchiCloud + RSI - alerts", overlay=true)
// ============================================================================== Strategy mode - uncomment to activate
strategy("Ichimoku Kinko Hyo Cloud - no offset - no repaint - RSI filter - strategy", shorttitle="IchiCloud + RSI - Strategy Tester Mode", overlay=true, pyramiding = 0,
  currency = currency.EUR, initial_capital = 2000, default_qty_type = strategy.percent_of_equity, default_qty_value = 100,
  calc_on_every_tick = true, calc_on_order_fills = true, commission_type = strategy.commission.percent, commission_value = 0.15)
// ==============================================================================

// ------------------------------------------------------------------------------

ichiCloud_offset   = input(false, title="Standard Ichimoku Cloud")                  // with the visual offset
ichiCloud_noOffset = input(true,  title="Ichimoku Cloud - no offset - no repaint")  // without the visual offset

conversion_prd = input(9, minval=1, title="Conversion Line Period - Tenkan-Sen")
baseline_prd   = input(27, minval=1, title="Base Line Period - Kijun-Sen")
baselineA_prd  = input(52, minval=1, title="Base Line Period - Kijun-Sen (auxiliary)")
leadingSpan_2prd = input(52, minval=1, title="Lagging Span 2 Periods - Senkou Span B")
displacement = input(26, minval=0, title="Displacement: (-) Chikou Span; (+) Senkou Span A")
extra_bars = input(1, minval=0, title="Displacement: additional bars")
laggingSpan_src = input(close, title="Lagging Span price source - Chikou-Span")

donchian(len) => avg(lowest(len), highest(len))
displ = displacement-extra_bars
// ------------------------------------------------------------------------------
// OFFSET:
conversion = donchian(conversion_prd)   // Conversion Line - Tenkan-Sen (9 Period)
baseline  = donchian(baseline_prd)      // Base Line - Kijun-Sen (26 Period)
baselineA = donchian(baselineA_prd)     // Base Line Period - Kijun-Sen (auxiliary)
leadingSpanA = avg(conversion, baseline)
leadingSpanB = donchian(leadingSpan_2prd)
laggingSpan = laggingSpan_src

// Color - bullish, bearish
col_cloud = leadingSpanA>=leadingSpanB ? color.green : color.red

// Cloud Lines
spanA = plot(ichiCloud_offset? leadingSpanA : na, offset=displ, title="Offset: Lead Line 1 - Senkou Span A cloud", color=color.green)
spanB = plot(ichiCloud_offset? leadingSpanB : na, offset=displ, title="Offset: Lead Line 2 - Senkou Span B cloud", color=color.red)
fill(spanA, spanB, color=col_cloud, transp=80, title="Offset: Ichimoku Cloud - Leading Span 1 & 2 based coloring")

// Other Lines
conversion_p = plot(ichiCloud_offset? conversion : na, title="Offset: Conversion Line - Tenkan-Sen", color=#0496ff)
standard_p = plot(ichiCloud_offset? baseline : na, title="Offset: Base Line - Kijun-Sen", color=#991515)
standardA_p = plot(ichiCloud_offset? baselineA : na, title="Offset: Base Line - Kijun-Sen (auxiliary)", color=color.teal)
lagging_Span_p = plot(ichiCloud_offset? laggingSpan : na, offset=-displ, title="Offset: Chikou Span (Lagging Span)", color=#459915)

// ------------------------------------------------------------------------------
// NO OFFSET:
conversion_noOffset = conversion[displ] // Conversion Line - Tenkan-Sen (9 Period)
baseline_noOffset  = baseline[displ]    // Base Line - Kijun-Sen (26 Period)
baselineA_noOffset = baselineA[displ]   // Base Line Period - Kijun-Sen (auxiliary)
leadingSpanA_noOffset = leadingSpanA[displ*2]
leadingSpanB_noOffset = leadingSpanB[displ*2]
laggingSpan_noOffset = laggingSpan[0]

// Color - bullish, bearish
col_cloud_noOffset = leadingSpanA_noOffset>=leadingSpanB_noOffset ? color.green : color.red

// Cloud Lines
spanA_noOffset = plot(ichiCloud_noOffset? leadingSpanA_noOffset : na, title="No offset: Lead Line 1 - Senkou Span A cloud", color=color.green, transp=0)
spanB_noOffset = plot(ichiCloud_noOffset? leadingSpanB_noOffset : na, title="No offset: Lead Line 2 - Senkou Span B cloud", color=color.red, transp=0)
fill(spanA_noOffset, spanB_noOffset, color=col_cloud_noOffset, transp=80, title="No offset: Ichimoku Cloud - Leading Span 1 & 2 based coloring")

// Other Lines
conversion_p_noOffset = plot(ichiCloud_noOffset? conversion_noOffset : na, title="No offset: Conversion Line - Tenkan-Sen", color=#0496ff, transp=0)
baseline_p_noOffset = plot(ichiCloud_noOffset? baseline_noOffset : na, title="No offset: Base Line - Kijun-Sen", color=#991515, transp=0)
baselineA_p_noOffset = plot(ichiCloud_noOffset? baselineA_noOffset : na, title="No offset: Base Line - Kijun-Sen (auxiliary)", color=color.teal, transp=0)
laggingSpan_p_noOffset = plot(ichiCloud_noOffset? laggingSpan_noOffset : na, title="No offset: Chikou Span (Lagging Span)", color=#459915, transp=0)

// ==============================================================================
// Conditions & Alerts (based on the lines without offset)

maxC = max(leadingSpanA_noOffset,leadingSpanB_noOffset)
minC = min(leadingSpanA_noOffset,leadingSpanB_noOffset)

// Trend start signals: crosses between Chikou Span (Lagging Span) and the Cloud (Senkou Span A, Senkou Span B)
uptrend_start   = crossover(laggingSpan_noOffset,maxC)
downtrend_start = crossunder(laggingSpan_noOffset,minC)

// Trends
uptrend   = laggingSpan_noOffset>maxC // Above Cloud
downtrend = laggingSpan_noOffset<minC // Below Cloud

// No trend: choppy trading - the price is in transition
notrend = maxC>=laggingSpan_noOffset and laggingSpan_noOffset>=minC

// Confirmations
uptrend_confirm   = crossover(leadingSpanA_noOffset,leadingSpanB_noOffset)
downtrend_confirm = crossunder(leadingSpanA_noOffset,leadingSpanB_noOffset)

// Signals - crosses between Conversion Line (Tenkan-Sen) and Base Line (Kijun-Sen)
bullish_signal = crossover(conversion_noOffset,baseline_noOffset)
bearish_signal = crossunder(conversion_noOffset,baseline_noOffset)

// Various alerts
alertcondition(uptrend_start,   title="Uptrend Started",   message="Uptrend Started")
alertcondition(downtrend_start, title="Downtrend Started", message="Downtrend Started")

alertcondition(uptrend_confirm,   title="Uptrend Confirmed",   message="Uptrend Confirmed")
alertcondition(downtrend_confirm, title="Downtrend Confirmed", message="Downtrend Confirmed")

alertcondition(bullish_signal, title="Buy Signal",  message="Buy Signal")
alertcondition(bearish_signal, title="Sell Signal", message="Sell Signal")

rsi_OBlevel = input(50, title="RSI Filter: Overbought level (0 = off)")
rsi_OSlevel = input(100,title="RSI Filter: Oversold level (100 = off)")
rsi_len = input(14,title="RSI Length")
rsi_src = input(close,title="RSI Price source")
rsi = rsi(rsi_src,rsi_len)

// Strategy -------------------------------
long_signal  = bullish_signal and uptrend   and rsi<=rsi_OSlevel // breakout filtered by the rsi
exit_long    = bearish_signal and uptrend
short_signal = bearish_signal and downtrend and rsi>=rsi_OBlevel // breakout filtered by the rsi
exit_short   = bullish_signal and downtrend

// Strategy alerts
alertcondition(long_signal, title="Long Signal - Uptrend",      message="Long Signal - Uptrend")
alertcondition(exit_long,   title="Long Exit Signal - Uptrend", message="Long Exit Signal - Uptrend")

alertcondition(short_signal, title="Long Signal - Downtrend",       message="Long Signal - Downtrend")
alertcondition(exit_short,   title="Short Exit Signal - Downtrend", message="Short Exit Signal - Downtrend")

// Plot areas for trend and transition
color_trend = uptrend? #00FF00 : downtrend? #FF0000 : notrend? color.new(#FFFFFF, 50) : na
fill(spanA_noOffset, spanB_noOffset, color=color_trend, transp=90, title="No offset: Ichimoku Cloud - Lagging Span & Cloud based coloring")

plotshape(ichiCloud_noOffset?uptrend_start:na, title="No offset: Uptrend Started", color=color.green, style=shape.circle, location=location.belowbar, size=size.tiny, text="Up")
plotshape(ichiCloud_noOffset?downtrend_start:na, title="No offset: Downtrend Started", color=color.red, style=shape.circle,location=location.abovebar, size=size.tiny, text="Down")

plotshape(ichiCloud_noOffset?uptrend_confirm:na, title="No offset: Uptrend Confirmed", color=color.green, style=shape.circle, location=location.belowbar, size=size.small, text="Confirm Up")
plotshape(ichiCloud_noOffset?downtrend_confirm:na, title="No offset: Downtrend Confirmed", color=color.red, style=shape.circle, location=location.abovebar, size=size.small, text="Confirm Down")

plotshape(ichiCloud_noOffset?long_signal:na, title="No offset: Long Signal", color=#00FF00, style=shape.triangleup, location=location.belowbar, size=size.small, text="Long")
plotshape(ichiCloud_noOffset?exit_long:na, title="No offset: Exit Long Signal", color=color.fuchsia, style=shape.triangledown, location=location.abovebar, size=size.small, text="Exit long")

plotshape(ichiCloud_noOffset?short_signal:na, title="No offset: Short Signal", color=#FF0000, style=shape.triangledown, location=location.abovebar, size=size.small, text="Short")
plotshape(ichiCloud_noOffset?exit_short:na, title="No offset: Exit Short Signal", color=color.fuchsia, style=shape.triangleup, location=location.belowbar, size=size.small, text="Exit short")

// ============================================================================== Strategy Component - uncomment to activate
if (long_signal)
    strategy.entry("Long",strategy.long)
if (exit_long)
    strategy.close("Long")
// if (short_signal)
//    strategy.entry("Short",strategy.short)
// if (exit_short)
//    strategy.close("Short")
// ==============================================================================


//@version=4
// This source code is subject to the terms of the Mozilla Public License 2.0 at https://mozilla.org/MPL/2.0/
// © colinmck


RSI_Period = input(10, title='RSI Length')
SF = input(5, title='RSI Smoothing')
QQE = input(2.438, title='Fast QQE Factor')
ThreshHold = input(10, title="Thresh-hold")

src = close
Wilders_Period = RSI_Period * 3 - 1

Rsi = rsi(src, RSI_Period)
RsiMa = ema(Rsi, SF)
AtrRsi = abs(RsiMa[1] - RsiMa)
MaAtrRsi = ema(AtrRsi, Wilders_Period)
dar = ema(MaAtrRsi, Wilders_Period) * QQE

longband = 0.0
shortband = 0.0
trend = 0

DeltaFastAtrRsi = dar
RSIndex = RsiMa
newshortband = RSIndex + DeltaFastAtrRsi
newlongband = RSIndex - DeltaFastAtrRsi
longband := RSIndex[1] > longband[1] and RSIndex > longband[1] ? max(longband[1], newlongband) : newlongband
shortband := RSIndex[1] < shortband[1] and RSIndex < shortband[1] ? min(shortband[1], newshortband) : newshortband
cross_1 = cross(longband[1], RSIndex)
trend := cross(RSIndex, shortband[1]) ? 1 : cross_1 ? -1 : nz(trend[1], 1)
FastAtrRsiTL = trend == 1 ? longband : shortband

// Find all the QQE Crosses

QQExlong = 0
QQExlong := nz(QQExlong[1])
QQExshort = 0
QQExshort := nz(QQExshort[1])
QQExlong := FastAtrRsiTL < RSIndex ? QQExlong + 1 : 0
QQExshort := FastAtrRsiTL > RSIndex ? QQExshort + 1 : 0

//Conditions

qqeLong = QQExlong == 1 ? FastAtrRsiTL[1] - 50 : na
qqeShort = QQExshort == 1 ? FastAtrRsiTL[1] - 50 : na

// Plotting

plotshape(qqeLong, title="QQE long", text="Long", textcolor=color.white, style=shape.labelup, location=location.belowbar, color=color.green, transp=0, size=size.tiny)
plotshape(qqeShort, title="QQE short", text="Short", textcolor=color.white, style=shape.labeldown, location=location.abovebar, color=color.red, transp=0, size=size.tiny)

// Alerts

alertcondition(qqeLong, title="Long", message="Long")
alertcondition(qqeShort, title="Short", message="Short")