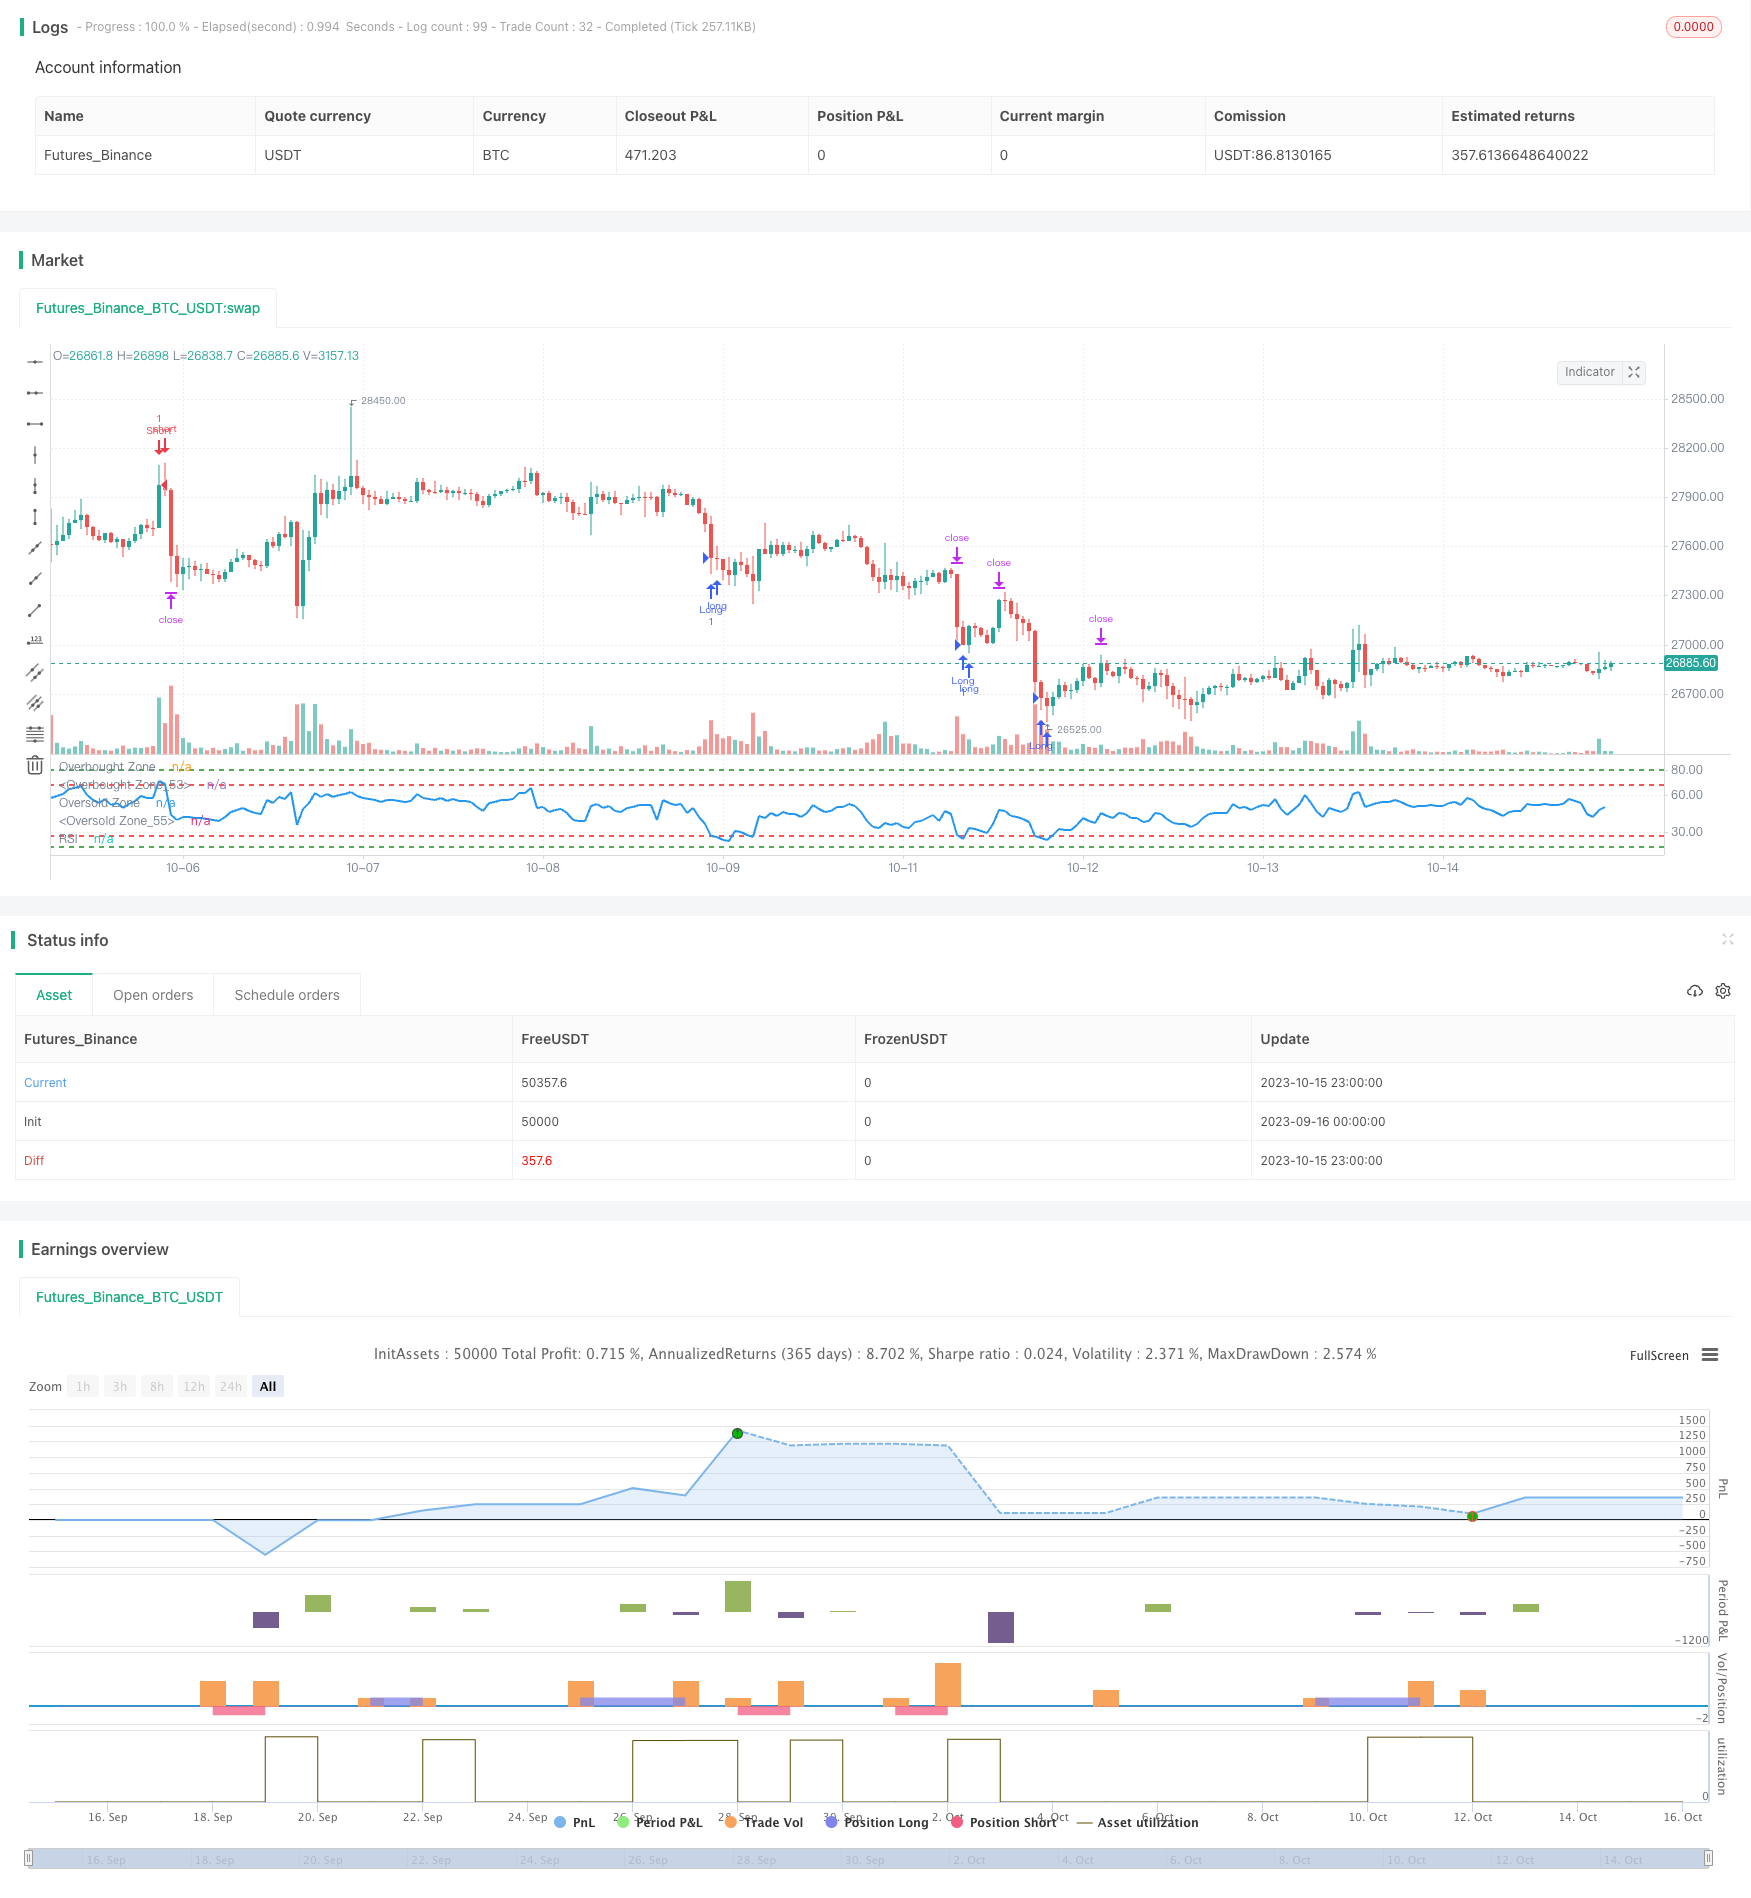
アルゴリズムRSI範囲突破戦略

概要
この戦略は,RSI指標の異なる区間の突破を監視することによって,低価格で買い,高価格で売ることを目的としています. RSIが低価格区間にあるときに買い,RSIが高価格区間にあるときに売るため,超値の超値が発生した場合に逆操作を行います.
戦略原則
RSIの長さは 14 サイクルに設定します.
RSIの範囲を設定します.
- RSI <= 27 範囲1
- RSI <= 18 区間2: RSI <= 18 区間2: RSI <= 18
RSIの範囲を設定します.
- RSI >=68 区間1: RSI >=68 区間1:
- RSI >=80 区間2: RSI >=80 区間2: RSI >=80
RSIが買入区間に入ると,追加入場:
- RSIが1から27の範囲に入ると,
- RSIが2から18の範囲に入ると,追加で1回します.
RSIが”売り込み”の範囲に入ると空白で入ります.
- RSIが1~68の範囲に入ると,空き1回
- 余分な空白1手
固定ストップは2500点,ストップは5000点.
RSIがシグナル区間から外れた後,相関ポジションを平らにする
優位分析
2つの区間の設定により,戦略は過剰買いと過剰売りを明確に判断し,反転の機会を逃さないことができます.
固定ストップストロップポイントの設定により,過度にストップダウンを追及しない
RSIは,他の指標よりも優れている,より成熟した超買超売判断指標です.
この戦略のパラメータを合理的に設定すると,トレンドの逆転点を効果的に捕捉し,余分な利益を得ることができます.
リスク分析
RSI指標は,市場が失敗し,継続的な空調損失を招く可能性があります.
固定ストップ・ストラップ・ポイントの設定は,市場の波動幅に合致しない可能性があり,利益を得ることができないか,早めにストップ・ストラップします.
不合理な区間設定は,見逃した取引機会や頻繁な取引の損失を引き起こす可能性があります.
この戦略は,パラメータ最適化に依存し,テスト周期と滑点制御に注意する必要があります.
最適化の方向
RSI指標の効果を異なる長さの周期でテストできます
購入区間を最適化し,異なる品種の特徴に適合させる
ダイナミックストップ・ストップ・ダメージは,より効率的で合理的なストップ・ダメージを研究することができます.
システム安定性を高めるため,他の指標と組み合わせたポートフォリオ取引を検討することができます.
区間パラメータを自動的に最適化して,戦略をより頑丈にするために,機械学習の方法を探索できます.
要約する
この戦略は,RSI指標の超買超売判断原理に基づいて設計されている. 双買い区間を設定することで,RSI指標の有効性を発揮し,一定の安定性を維持しながら,市場の超買超売現象を効果的に捕捉できる逆操作を行う. しかし,この戦略にも一定のパラメータ依存性があり,異なる品種に対して最適化テストを行う必要があります.
/*backtest
start: 2023-09-16 00:00:00
end: 2023-10-16 00:00:00
period: 1h
basePeriod: 15m
exchanges: [{"eid":"Futures_Binance","currency":"BTC_USDT"}]
*/

// This source code is subject to the terms of the Mozilla Public License 2.0 at https://mozilla.org/MPL/2.0/
// © Rawadabdo

// Ramy's Algorithm

//@version=5
strategy("BTC/USD - RSI", overlay=false, initial_capital = 5000)

// User input
length = input(title = "Length", defval=14, tooltip="RSI period")

first_buy_level = input(title = "Buy Level 1", defval=27, tooltip="Level where 1st buy triggers")
second_buy_level = input(title = "Buy Level 2", defval=18, tooltip="Level where 2nd buy triggers")

first_sell_level = input(title = "Sell Level 1", defval=68, tooltip="Level where 1st sell triggers")
second_sell_level = input(title = "Sell Level 2", defval=80, tooltip="Level where 2nd sell triggers")

takeProfit= input(title="target Pips", defval=2500, tooltip="Fixed pip stop loss distance")
stopLoss = input(title="Stop Pips", defval=5000, tooltip="Fixed pip stop loss distance")

lot = input(title = "Lot Size", defval = 1, tooltip="Trading Lot size")

// Get RSI
vrsi = ta.rsi(close, length)

// Entry Conditions
long1 = (vrsi <= first_buy_level and vrsi>second_buy_level)
long2 = (vrsi <= second_buy_level)

short1= (vrsi >= first_sell_level and vrsi<second_sell_level)
short2= (vrsi >= second_sell_level)


// Entry Orders
// Buy Orders
if (long1 and strategy.position_size == 0)
    strategy.entry("Long", strategy.long, qty=lot, comment="Buy")
    if (long2 and  strategy.position_size == 0)
        strategy.entry("Long", strategy.long, qty=lot, comment="Buy")

// Short Orders
if (short1 and strategy.position_size == 0)
    strategy.entry("Short", strategy.short,qty=lot, comment="Sell")
    if (short2 and strategy.position_size == 0)
        strategy.entry("Short", strategy.short,qty=lot, comment="Sell")

// Exit our trade if our stop loss or take profit is hit
strategy.exit(id="Long Exit", from_entry="Long",qty = lot, profit=takeProfit, loss=stopLoss)
strategy.exit(id="Short Exit", from_entry="Short", qty = lot, profit=takeProfit, loss=stopLoss)

// plot data to the chart
hline(first_sell_level, "Overbought Zone", color=color.red, linestyle=hline.style_dashed, linewidth = 2)
hline(second_sell_level, "Overbought Zone", color=color.green, linestyle=hline.style_dashed, linewidth = 2)
hline(first_buy_level, "Oversold Zone", color=color.red, linestyle=hline.style_dashed, linewidth = 2)
hline(second_buy_level, "Oversold Zone", color=color.green, linestyle=hline.style_dashed, linewidth = 2)
plot (vrsi, title = "RSI", color = color.blue, linewidth=2)