ロングおよびショートパワー戦略のバックテスト

1
Follow
1781
Followers
概要
多空力策略は,Dr.Alexander Elderによって開発され,市場における買入と売却の圧力をElder-ray指標によって測定する.Elder-ray指標は通常,三画面取引システムと一緒に使用されますが,単独でも使用できます.
アレキサンダー・エルダー博士は,13日指数移動平均 ((EMA) を使って,市場価値の合意を表している.多角力は,買い手が価格を価値の合意より高く押し上げる能力を反映している.空気の力は,売り手が価格を平均価値の合意より低く押し上げる能力を反映している.
多頭力は高点から13日EMAを引く.空頭力は低点から13日EMAを引く.
戦略原則
この戦略は,多空力の指標を計算して市場の多空状態を判断する.
- 市場価値のコンセンサスとして13日EMAを計算する
- 複数頭力の計算:当日の最高値から13日のEMAを引いた
- 空気力の計算:当日の最低値から13日のEMAを引いた
- 多頭力と空頭力と<unk>値の関係を比較し,多頭空調信号の判断
- 逆取引の選択肢があります
多頭力が<unk>値より大きいときは多信号,空頭力が<unk>値より大きいときは空信号とする.また,逆取引の選択肢がある.
優位分析
- 市場空虚状態を判断する多空力指標は,簡単で分かりやすい
- 設定可能なパラメータの柔軟性,<unk>値と周期の調整
- 逆取引の選択により,異なる市場環境に対応できます.
- 指数移動平均を用いて,突発事件に対する感度が低い
リスク分析
- 多空力の指標は誤信号を発生しやすいので,トレンドと他の指標のフィルタリングを組み合わせる必要があります.
- 固定サイクルは市場の変化に適応できない.自適應サイクルの最適化を採用することができる.
- 市場が過大損失を伴うため,止損は存在しない
- 市場への参入のタイミングの欠如
ストップロスを設定し,移動平均周期を最適化し,トレンド指標などと組み合わせて最適化することができる.
最適化の方向
- 移動平均周期パラメータを最適化して,自適應周期EMAを使用
- トレンド指標のフィルターで逆行を避ける
- 単一損失を抑えるためのストップ・ロース戦略を強化する
- 他の指標と組み合わせて市場への出入りのタイミングを決める
- 機械学習技術による最適化パラメータ設定
要約する
多空力策は,Elder-ray指標によって市場の多空状態を判断し,シンプルで直感的で,パラメータを構成できる。しかし,誤信号を生成しやすいため,トレンド判断と止損を加えるためにさらに最適化する必要がある。この策の考え方は学ぶに値するが,直接適用するには慎重である。
Source
Pine
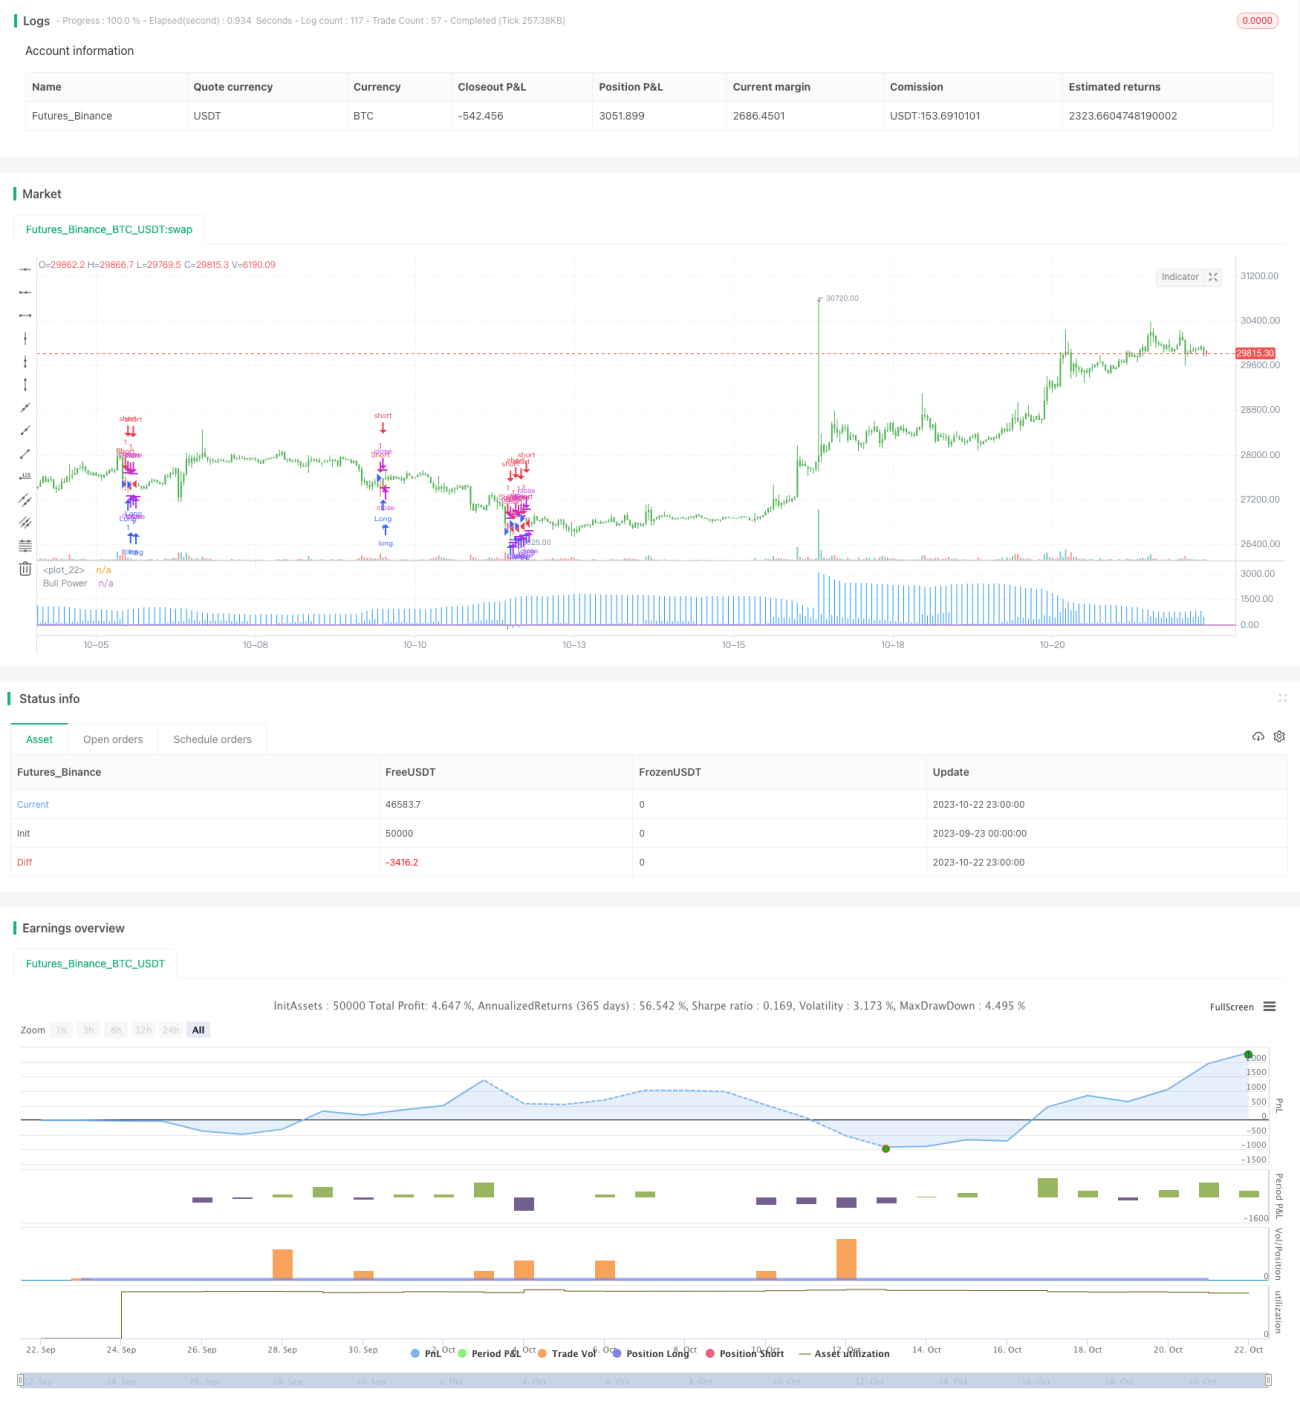
/*backtest
start: 2023-09-23 00:00:00
end: 2023-10-23 00:00:00
period: 1h
basePeriod: 15m
exchanges: [{"eid":"Futures_Binance","currency":"BTC_USDT"}]
*/

//@version = 2
////////////////////////////////////////////////////////////
//  Copyright by HPotter v1.0 08/12/2016
// Developed by Dr Alexander Elder, the Elder-ray indicator measures buying Strategy parameters
Related strategies
Comment
All comments (0)
No data
- 1