蓄積RSIブレイクアウト戦略

1
Follow
1781
Followers
概要
この戦略は,累積RSI指標のトレンド認識を利用して,RSI指標の累積値が重要な<unk>値を破るときに買入と売却を行う.この戦略は,市場ノイズを効果的にフィルターし,より長い線のトレンド取引機会をロックすることができます.
戦略原則
この戦略は,主に累積RSI指標に基づいて取引決定を行う.累積RSI指標は,RSI指標の累積値であり,パラメータcumlenを設定することにより,RSI指標の数値をcumlen日間で累積して累積RSI指標を得ることができます.この指標は,短期市場のノイズをフィルターすることができます.
累積RSI指標でボリンジャー帯を横切ったとき,買入開設操作が行われ,累積RSI指標でボリンジャー帯を横切ったとき,平仓操作が行われる. ボリンジャー帯を横切ったとき,過去数年のデータから計算され,動態の変化の基準価格である.
さらに,戦略はトレンドフィルターオプションを追加した. 100日移動平均より高い価格,つまりトレンドの上昇チャネルにある場合にのみ,買い出し開店が行われる. このフィルターは,価格の揺れ時に誤った取引を防ぐことができる.
戦略的優位性
- 累積RSI指標を利用してノイズを効果的にフィルターし,中長線トレンドをロックします.
- トレンドフィルターを追加し,不合理な取引を避ける
- 固定値ではなく,ブレイクダイナミックな基準値で判断
- 設定可能なパラメータが多く,異なる市場に対応してパラメータを調整できます.
- 10年後の見直しで,買い買い戦略よりもはるかに高い収益を上げました.
リスクと改善
- 策略は,単一の指標の累積RSIのみに基づいて意思決定を行い,他の判断指標またはフィルターを追加して総合的な判断を行うことができます.
- 固定倍数のレバレッジが高く,レバレッジ比率は撤収に応じて調整できます.
- バイトの機会を増やすことを考えてください
- 最適化可能なパラメータの組み合わせ,異なる市場条件でパラメータ設定が大きく異なる
- ポジションの条件を豊かにしたり,止損ポジションを増やしたり,止損を移動したりする
- 他の戦略の組み合わせと連携して検討できる
要約する
累積RSI突破戦略は,全体的に流暢で論理的に明確で,累積RSI指標によって効果的波動をシフトし,トレンド判断を増加させ,中長線トレンドを正確に把握し,歴史の反省パフォーマンスを優れています.しかし,パラメータの設定を調整し,判断指標を増加させ,平準ポジション条件を豊かにすることで,より健壮で包括的なトレンド戦略を構築するために,最適化できる余地があります.この戦略のアイデアは,さらなる探索と応用に値する新しいものです.
Source
Pine
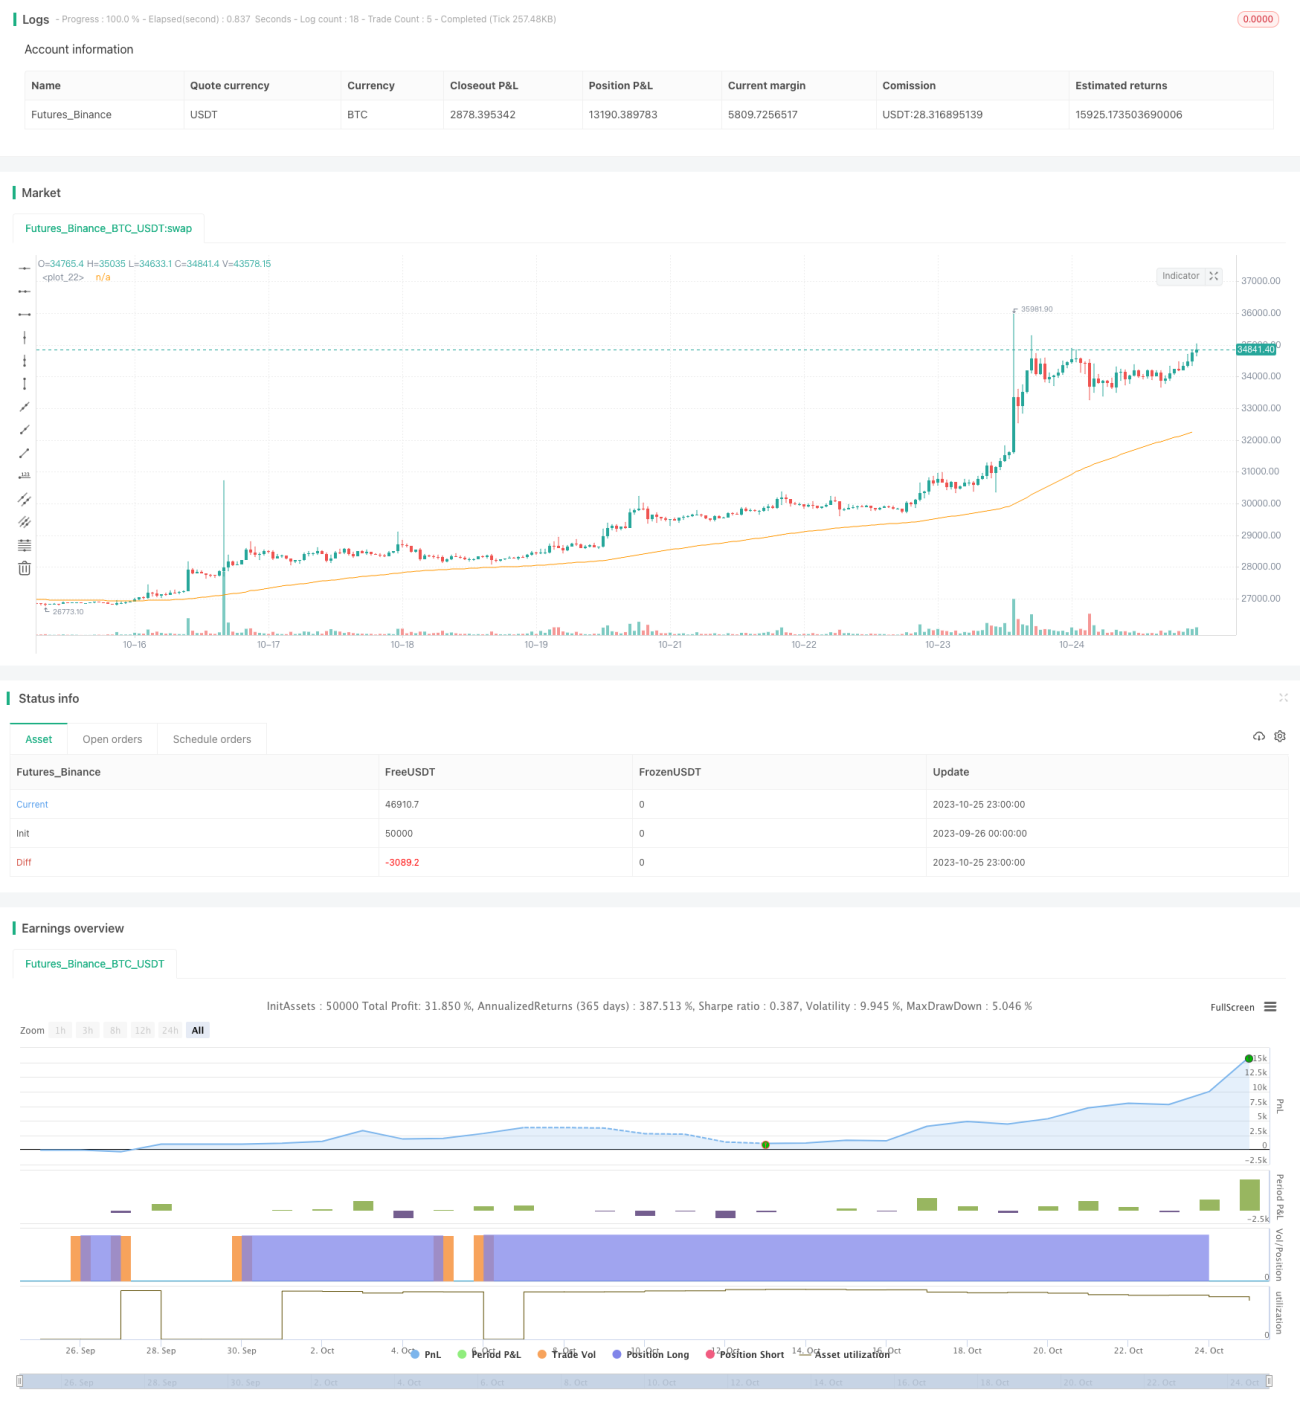
/*backtest
start: 2023-09-26 00:00:00
end: 2023-10-26 00:00:00
period: 1h
basePeriod: 15m
exchanges: [{"eid":"Futures_Binance","currency":"BTC_USDT"}]
*/

// This source code is subject to the terms of the Mozilla Public License 2.0 at https://mozilla.org/MPL/2.0/
// @version=5
// Author = TradeAutomation
Strategy parameters
Related strategies
Comment
All comments (0)
No data
- 1