移動平均とスーパートレンドに基づくトレンドフォロー戦略

概要
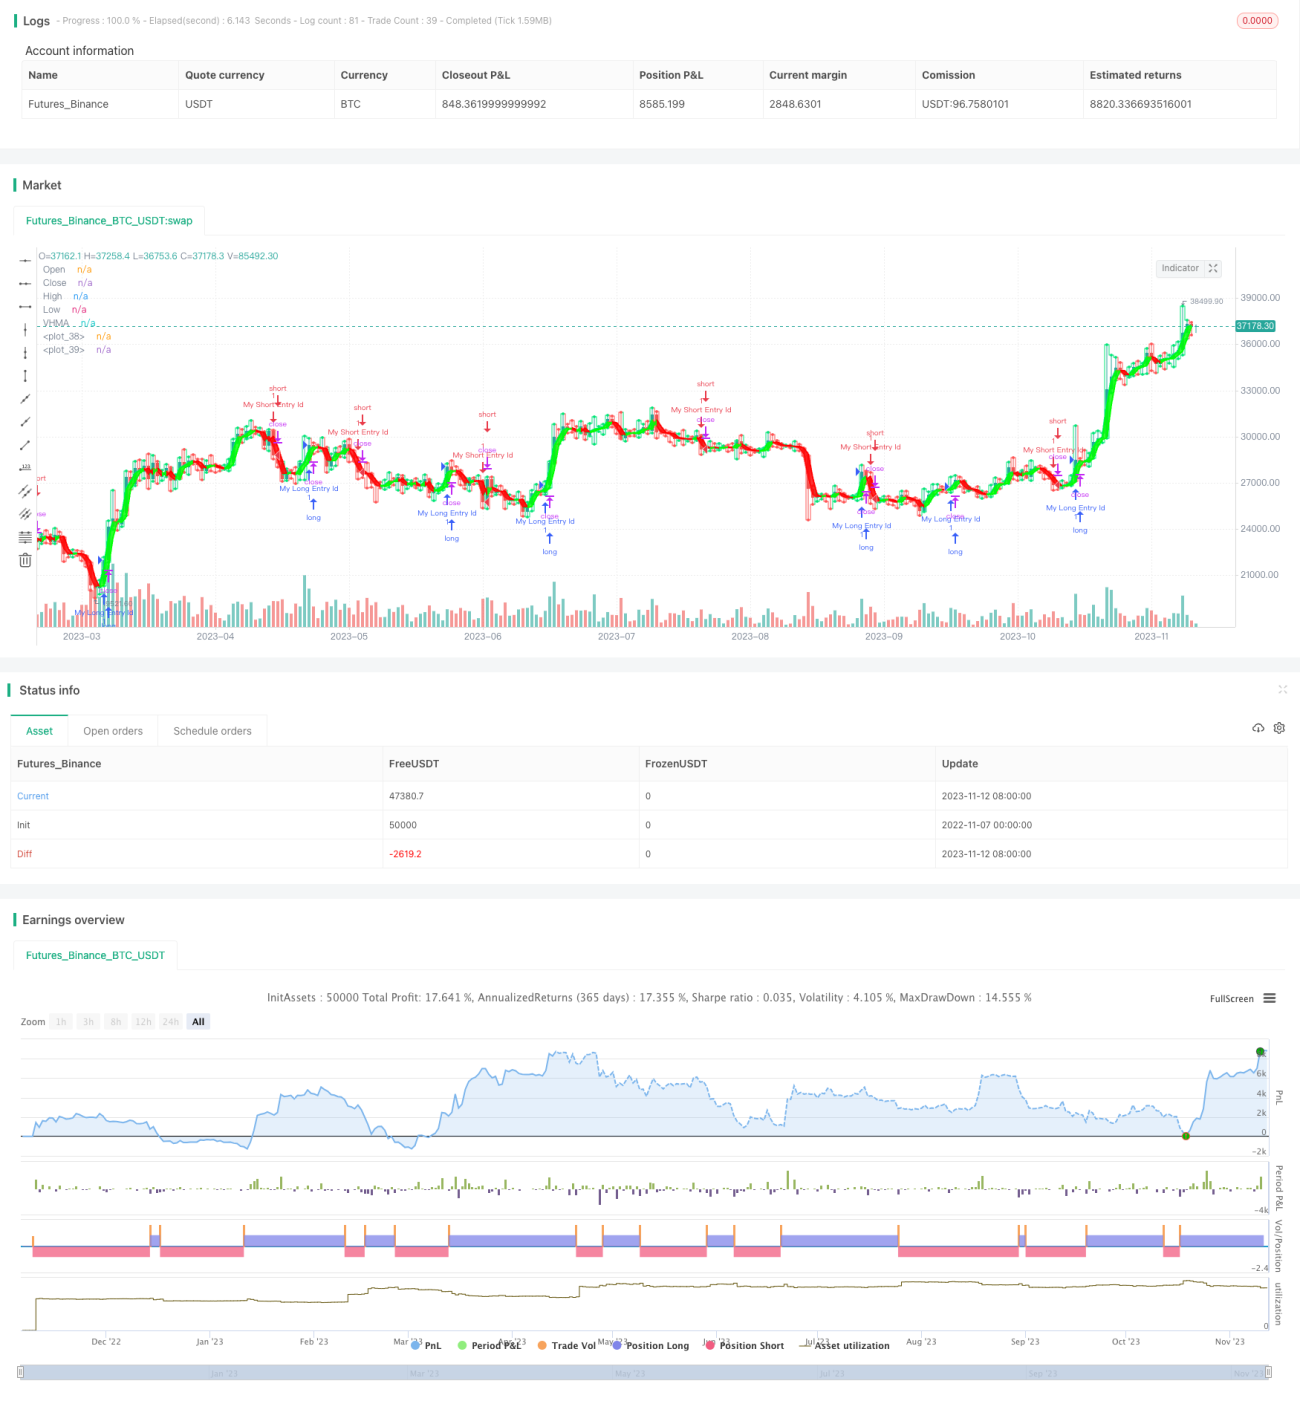
この戦略は均線指標と超トレンド指標を組み合わせて,トレンドへのフォロー操作を実現する.トレンドが上昇する時は多めに,トレンドが低下する時は空っぽにする.
戦略原則
-
負の移動平均MAを計算する.取引量を重みとして使用し,一定の周期における負の平均価格を計算する.
-
Hull移動平均は,価格の変化に対してより敏感である.
-
超トレンド指標の計算。超トレンド指標はATRと組み合わせて,価格トレンドの変化を見ることができる。上線と下線の計算。
-
閉盘価格が上線を超えると,多めに; 閉盘価格が下線を下回ると,空いてください.
-
オープン価格,クローズ価格,最高価格,最低価格などの補助指標をグラフに描き,価格の変化をより直観的に観察する.
-
買いと売却の意思決定を指標の交差で行う.
優位分析
-
この戦略は,平均線指標と超トレンド指標を組み合わせて,トレンドの変化をより正確に捉えることができます.
-
ハル平均線は価格変化に敏感で,トレンドの転換を早期に発見するのに役立ちます.
-
超トレンド指標は,市場の変動に合わせて動的に上下を調整します.
-
補助指標は,価格の変化を直視的に表示し,指標信号と組み合わせて判断を行う.
-
策略パラメータの最適化スペースは広く,平均線周期,超トレンド倍数などのパラメータを調整できます.
リスク分析
-
市場を整理する際には,誤ったシグナルが生み出され,不必要な取引が起こる可能性があります.
-
複数の指標を同時に監視する必要があり,戦略は比較的複雑です.
-
異なる品種の特徴に合わせて指標パラメータを適切に調整する必要があります.
-
ストップ・ロスを厳格に管理し,単一の損失を過大にしないようにする.
-
経費の影響をコントロールする必要があります.
最適化の方向
-
異なる平均線のパラメータをテストし,市場に対してより敏感な平均線指標を選択できます.
-
異なる超トレンドの倍数をテストし,トレンドの変化をタイムリーに捉える数値を選択できます.
-
波動率の指標と組み合わせて,波動が大きくなるとポジションを下げる.
-
突破条件が加えられ,誤信号が整合時に発生しないようにする.
-
ストップ・ロスの戦略を最適化して,市場特性に合わせてストップ・ロスを行う.
要約する
この戦略は,均線指標と超トレンド指標を組み合わせてトレンドの方向を判断し,トレンドをフォローする操作を行う.指標間の相互検証が可能で,より正確にトレンドを判断できるという利点がある.しかし,偽信号の干渉に注意する必要がある.パラメータ最適化とリスク制御により,戦略の効果をさらに改善することができる.この戦略は,傾向性強い品種にトレンドフォローする操作を行うのに適している.
- 1