デュアルボリンジャーバンドボリューム取引戦略


作成日: 2023-11-16 17:36:00 最終変更日: 2023-11-16 17:36:00
コピー: 0 クリック数: 722
1
フォロー
1617
フォロワー

デュアルボリンジャーバンドボリューム取引戦略

概要

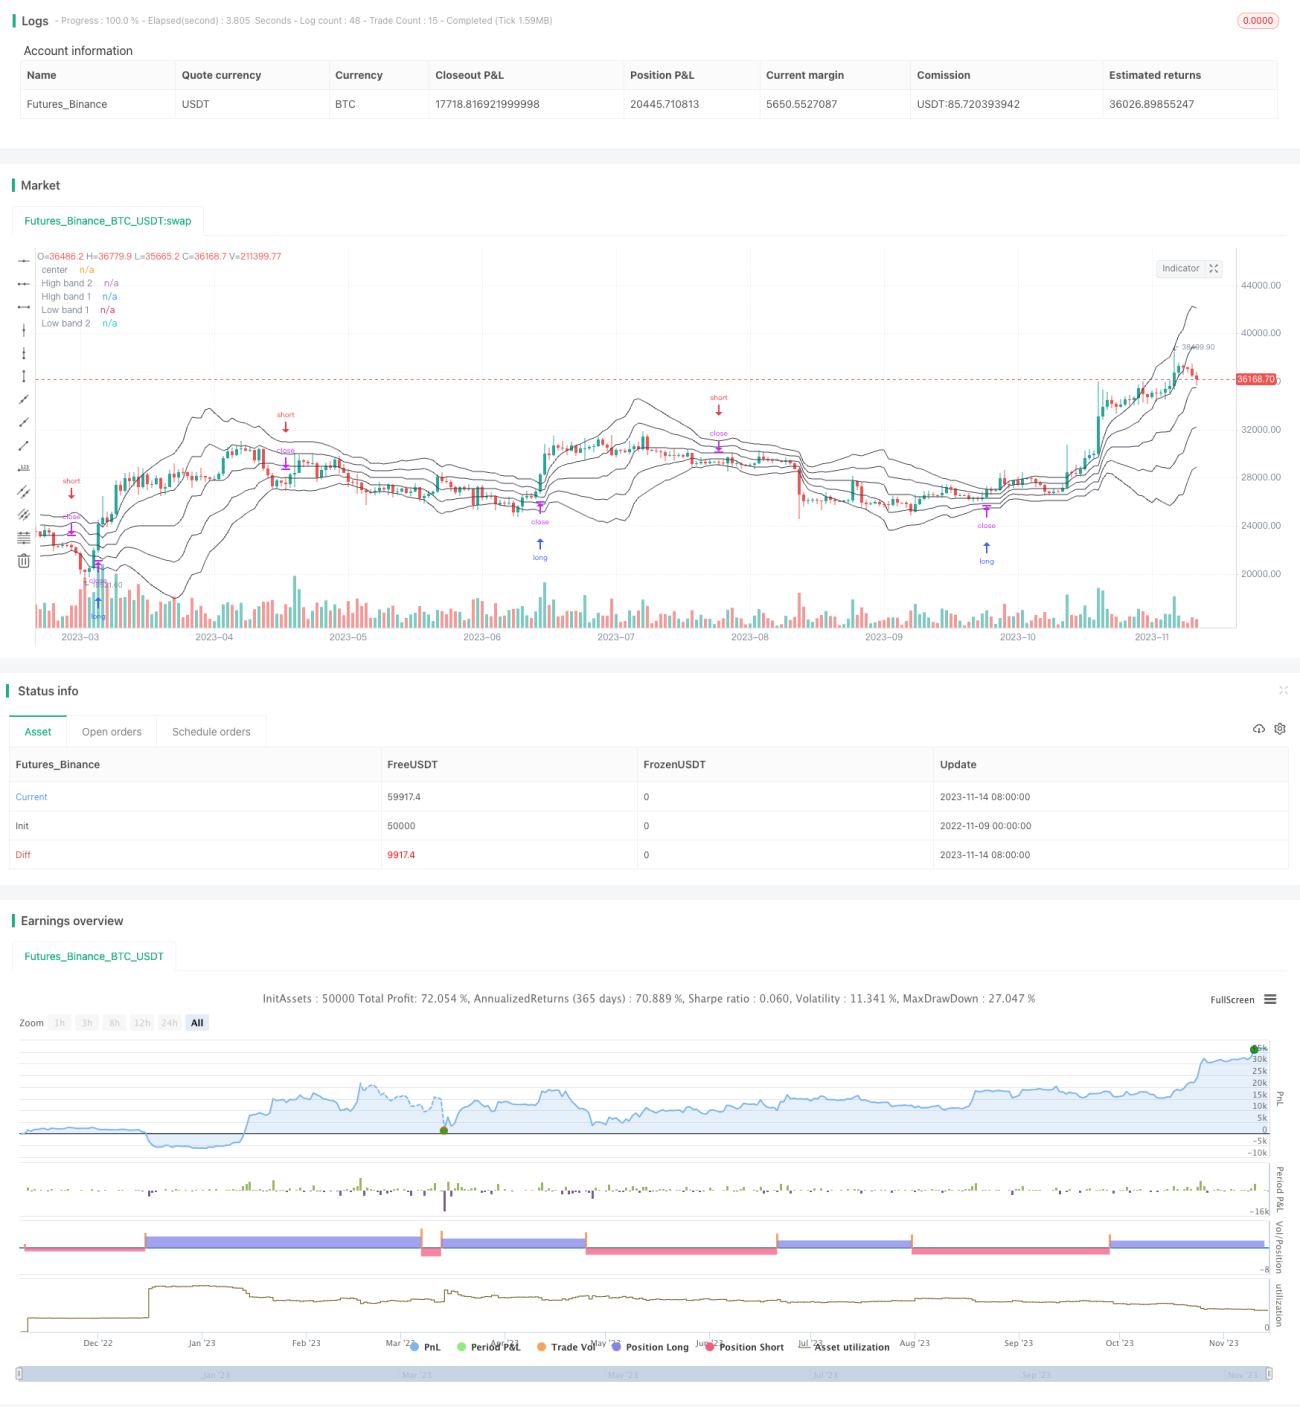
この戦略は,ブリン帯の概念に基づいて,価格チャネルの上下軌道を設定し,それによりトレンド判断と取引シグナルを生成する.具体的には,チャネルの帯域として価格の平均絶対偏差を計算し,チャネルの中間軌道を価格の単純な移動平均として計算し,上線と下線をそれぞれ中線に1倍または2倍のチャネルの帯域を加減する.価格が上線を突破するときに多めにし,下線を突破するときに空にする.

原則

この戦略は以下の内容から構成されています.

  1. 価格の真ん中線,つまり価格の単純な移動平均を計算する.

  2. 価格の絶対偏差の単純移動平均をチャネル帯域として計算する.

  3. 中軌と帯域の範囲に応じて上下軌を決定する。上軌は中軌に帯域を1倍または2倍加え,下軌は中軌に帯域を1倍または2倍減算する。

  4. 多空トレンド判断指標を計算する. 上線2より高い価格が多頭,下線2より低い価格が空頭である.

  5. 取引シグナルを生成する。価格が上線2を突破する時は多し,下線2を突破する時は空にする。

  6. 止損線を設定する. 多単止損線は下線1で,空単止損線は上線1である.

  7. 資金管理の要求に従ってポジションを計算する.

この戦略は,移動平均判断トレンド,ブリン帯判断超買超売,突破して反転する思想を融合している.双線差によって傾向の強さを判断し,同時にブリン帯の回帰の中軸の機能を発揮し,全体的により安定した取引システムを形成している.

優位分析

この戦略の利点は以下の通りです.

  1. ツインレールシステムを使うと,トレンドの強さや弱さをよりよく判断できます.

  2. ブリンには強力な回帰機能があり,偽突破を効果的に防ぐことができる.

  3. 双軌差はブリン帯回帰の中軸と協働し,より安定した取引信号を形成する.

  4. リスク管理のための明確な Exit ロジックがあります.

  5. ポジション設定は,資金管理要件に適合し,超レバレッジを回避する.

  6. 戦略は明確で,理解し,最適化することが容易です.

  7. 柔軟に設定できるパラメータで,異なる市場に適した最適化.

リスク分析

この戦略にはいくつかのリスクがあります.

  1. ブリン帯のパラメータ設定が不適切である場合,防護城河効果が起こり,価格が効果的に追跡できない.

  2. 双線差は,トレンドを誤判する事態を完全に回避するものではありません.

  3. 市場が揺れ動いている時,無効な信号が多く出ます.

  4. 突破口を偽造すると,損失が生じます.

  5. サイクルの転換点を逃す可能性がある.

  6. ストップポイントの制限よりも,無限のトレンドを追跡することは不可能である.

対応するリスク管理策:

  1. ブリン帯は,異なる周期に対応できるように,パラメータを最適化.

  2. 組合せの他の指標を確認して,誤判を避ける.

  3. ポジションを低くし,単一損失をコントロールする.

  4. ストップ・ロスを最適化して,利回り率を保証する.

  5. 遅延を減らすために周期を適切に短縮する.

  6. “風力制御は安定し,無限に追いかけるのは無理だ”

最適化の方向

この戦略は以下の方向から最適化できます.

  1. ブリン帯のパラメータを最適化して,価格をよりよく追跡できるようにする.自適化パラメータを導入することができる.

  2. EMA,DWMAなどの異なる移動平均を試してみてください.

  3. トレンドフィルターを追加し,波動市場の誤取引を避ける.MACDなども考慮できる.

  4. 積極的な出場 Exit を追加して,より多くのトレンドの利益を得ます. 小規模なストップ,移動ストップ,出場指標なども考慮できます.

  5. 複数のタイムサイクルを導入し,組み合わせる.異なるサイクルは,異なる市場状況に適しています.

  6. 取引量突破などの追加条件の論理を追加し,偽突破を避ける.

  7. ブリン・バンドを逆転させ,上線で売って下線で買うことも考えられます.

  8. パラメータ最適化テストを行い,最適なパラメータ組み合わせを探します.

要約する

この戦略は,全体的な考え方が明確で,強い安定性を持っています.同時に,一定の改善の余地があり,パラメータ最適化,論理最適化,リスク管理などの方面でさらに完善され,非常に実用的な量化取引戦略になることができます.この戦略は,量化取引の入門戦略に優れた考え方参照を提供します.

ストラテジーソースコード
/*backtest
start: 2022-11-09 00:00:00
end: 2023-11-15 00:00:00
period: 1d
basePeriod: 1h
exchanges: [{"eid":"Futures_Binance","currency":"BTC_USDT"}]
*/

// This source code is subject to the terms of the Mozilla Public License 2.0 at https://mozilla.org/MPL/2.0/
// © noro

//@version=4
strategy(title = "Noro's Bands Strategy", shorttitle = "Bands", overlay = true, default_qty_type = strategy.percent_of_equity, default_qty_value = 100, pyramiding = 0, commission_value = 0.1)

//Sattings
needlong = input(true, defval = true, title = "Long")
needshort = input(true, defval = true, title = "Short")
lotsize = input(100, defval = 100, minval = 1, maxval = 10000, title = "Lot, %")
len = input(20, defval = 20, minval = 1, maxval = 1000, title = "Length")
src = input(ohlc4, title = "Source")
showbb = input(true, title = "Show Bands")
showof = input(true, title = "Show Offset")
showbg = input(false, title = "Show Background")
fromyear = input(1900, defval = 1900, minval = 1900, maxval = 2100, title = "From Year")
toyear = input(2100, defval = 2100, minval = 1900, maxval = 2100, title = "To Year")
frommonth = input(01, defval = 01, minval = 01, maxval = 12, title = "From Month")
tomonth = input(12, defval = 12, minval = 01, maxval = 12, title = "To Month")
fromday = input(01, defval = 01, minval = 01, maxval = 31, title = "From day")
today = input(31, defval = 31, minval = 01, maxval = 31, title = "To day")

//PriceChannel
lasthigh = highest(src, len)
lastlow = lowest(src, len)
center = (lasthigh + lastlow) / 2

//Distance
dist = abs(src - center)
distsma = sma(dist, len)
hd = center + distsma
ld = center - distsma
hd2 = center + distsma * 2
ld2 = center - distsma * 2

//Trend
trend = 0
trend := high > hd2 ? 1 : low < ld2 ? -1 : trend[1]
bgcol = showbg == false ? na : trend == 1 ? color.lime : color.red
bgcolor(bgcol, transp = 70)

//Lines
colo = showbb == false ? na : color.black
offset = showof ? 1 : 0
plot(hd2, color = colo, linewidth = 1, transp = 0, offset = offset, title = "High band 2")
plot(hd, color = colo, linewidth = 1, transp = 0, offset = offset, title = "High band 1")
plot(center, color = colo, linewidth = 1, transp = 0, offset = offset, title = "center")
plot(ld, color = colo, linewidth = 1, transp = 0, offset = offset, title = "Low band 1")
plot(ld2, color = colo, linewidth = 1, transp = 0, offset = offset, title = "Low band 2")

//Trading
size = strategy.position_size
needstop = needlong == false or needshort == false
truetime = time > timestamp(fromyear, frommonth, fromday, 00, 00) and time < timestamp(toyear, tomonth, today, 23, 59)
lot = 0.0
lot := size != size[1] ? strategy.equity / close * lotsize / 100 : lot[1]
if distsma > 0
    strategy.entry("Long", strategy.long, lot, stop = hd2, when = truetime and needlong)
    strategy.entry("Short", strategy.short, lot, stop = ld2, when = truetime and needshort)
sl = size > 0 ? ld2 : size < 0 ? hd2 : na
if size > 0 and needstop
    strategy.exit("Stop Long", "Long", stop = sl)
if size < 0 and needstop
    strategy.exit("Stop Short", "Short", stop = sl)
if time > timestamp(toyear, tomonth, today, 23, 59)
    strategy.close_all()
    strategy.cancel("Long")
    strategy.cancel("Short")