コナーの二重移動平均RSI反転取引戦略

1
Follow
1779
Followers
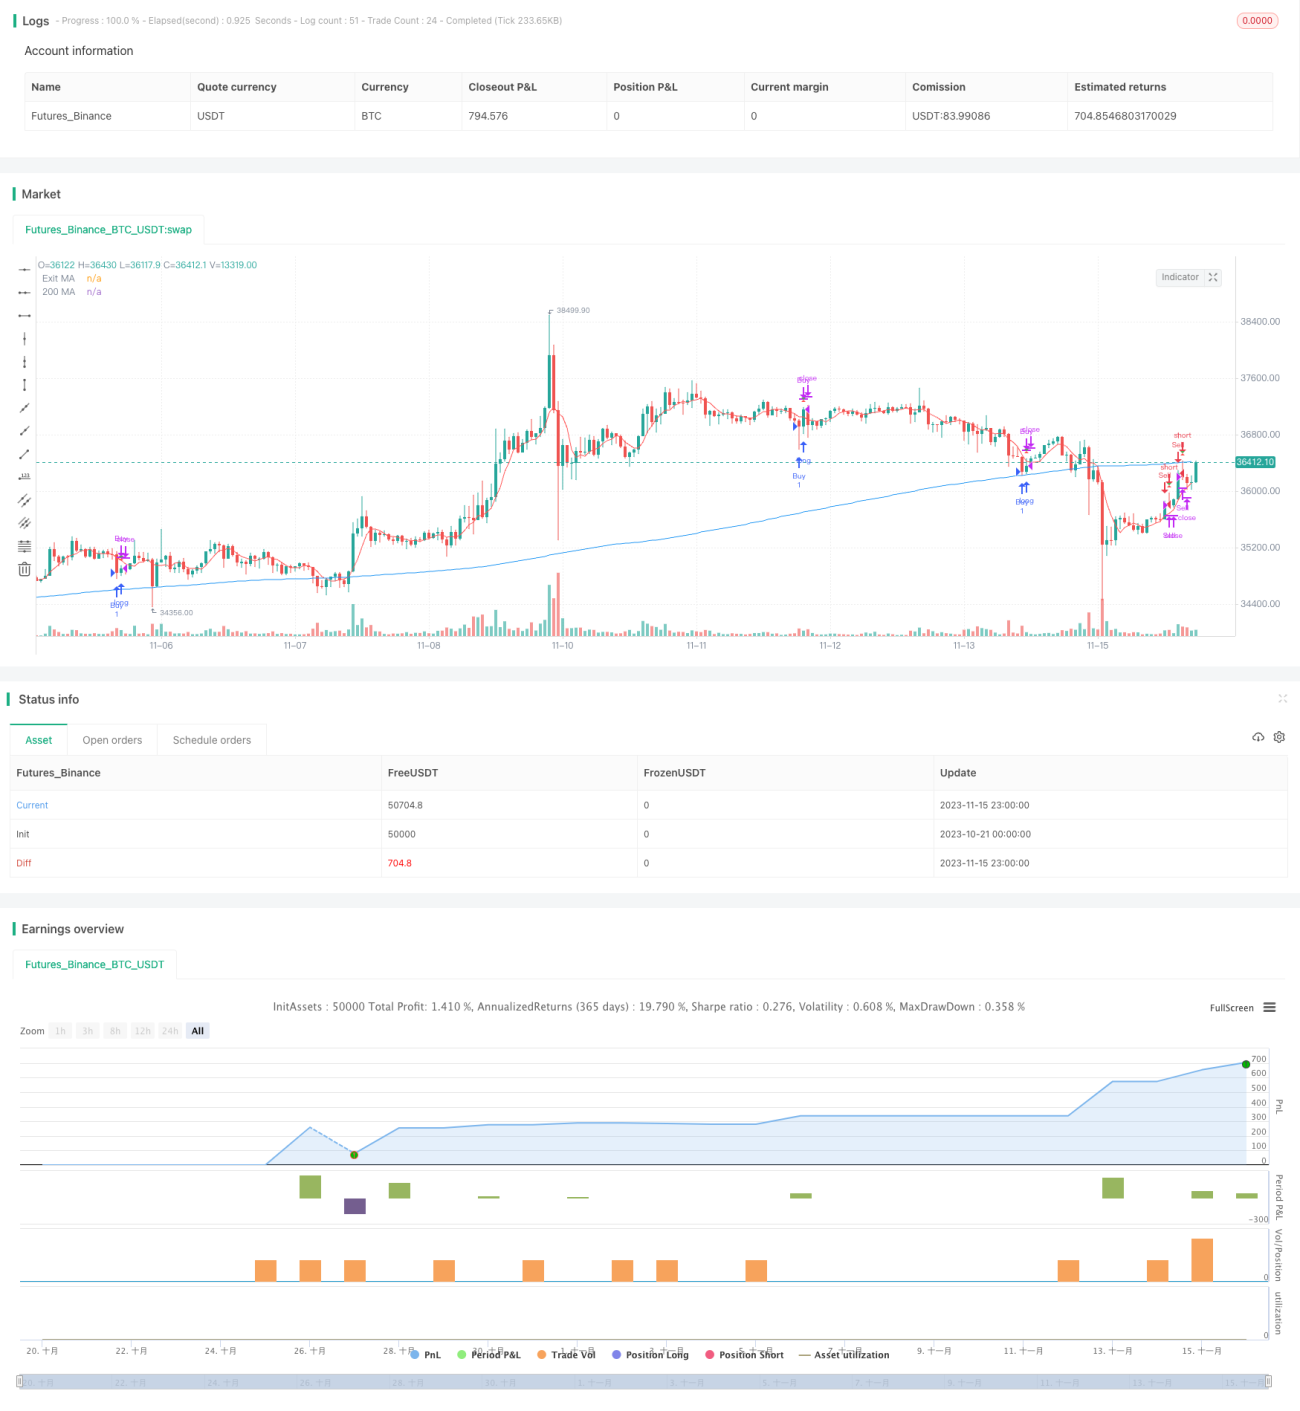
概要
コナー双均線RSI反転取引戦略は,比較的強い指数 ((RSI) と双均線を組み合わせて,高い確率の反転取引の機会を探している.短期および長期のトレンドが逆転するとき,この戦略は,状況が転じようとしていることを判断し,ポジションを構築する.
戦略原則
この戦略は,RSIと双均線を同時に使って市場のトレンドを判断する. まず,短期トレンドの逆転を判断するために2サイクルRSIを計算する. 次に,短期RSIを計算して長期トレンドの方向を判断する. 短期RSIが超買/超売り領域から反発し,長期トレンドと逆転すると,状況が逆転を迫ることを示す取引ポジションを確立する.
入場シグナル:RSIは超売り区域 ((デフォルト5) より小さいが,短期価格が長期価格より高くなると多出;RSIは超買い区域 ((デフォルト95) より大きいが,短期価格が長期価格より低くなると空出.
出場信号:5周期短期平均線がポジション保持方向と入場方向の反対の信号を発したときに出場;またはストップ損失 ((デフォルト損失3%) 〜.
戦略的優位分析
この戦略は,市場構造を判断する複数の指標を組み合わせて,取引の正確性を向上させることができる.具体的には,以下の利点があります.
- RSIを使って短期的な反転点を判断し,反転信号の信頼性を移動平均でフィルターします.
- 双均線が形成され,<unk>化を防ぐ
- 短期平均線は反転信号を再確認し,出場の可能性が高いことを確認した.
- リスク管理と止損システム
戦略的リスク分析
この戦略にはいくつかのリスクがあります.
- RSIは市場が激しく波動する時に誤った信号を発する可能性が高い.
- 複数の指標の組み合わせ判断,パラメータ最適化が複雑である
- 逆転は成功するとは限らない.
戦略最適化の方向性
この戦略は以下の点で最適化できます.
- RSIパラメータを最適化して,最適な反転パラメータの組み合わせを探します.
- 移動平均のパラメータをテストする
- ストップ・ストップ戦略の最適化
- トレンド判断の指標を高め,逆転の失敗を避ける
要約する
コナー双均線RSI反転取引戦略は,RSI反転信号と双均線フィルターを使用して,高確率の位置で市場の反転を捕捉する.この戦略は,複数の指標判断を使用し,取引戦略の安定性を効果的に向上させることができます.次のステップは,パラメータ最適化とリスク管理の改善により,戦略の優位性をさらに拡大し,より高い取引効率を得ることを期待しています.
Source
Pine
Strategy parameters
Related strategies
Comment
All comments (0)
No data
- 1