日々の終値比較に基づく定量取引戦略

1
Follow
1779
Followers
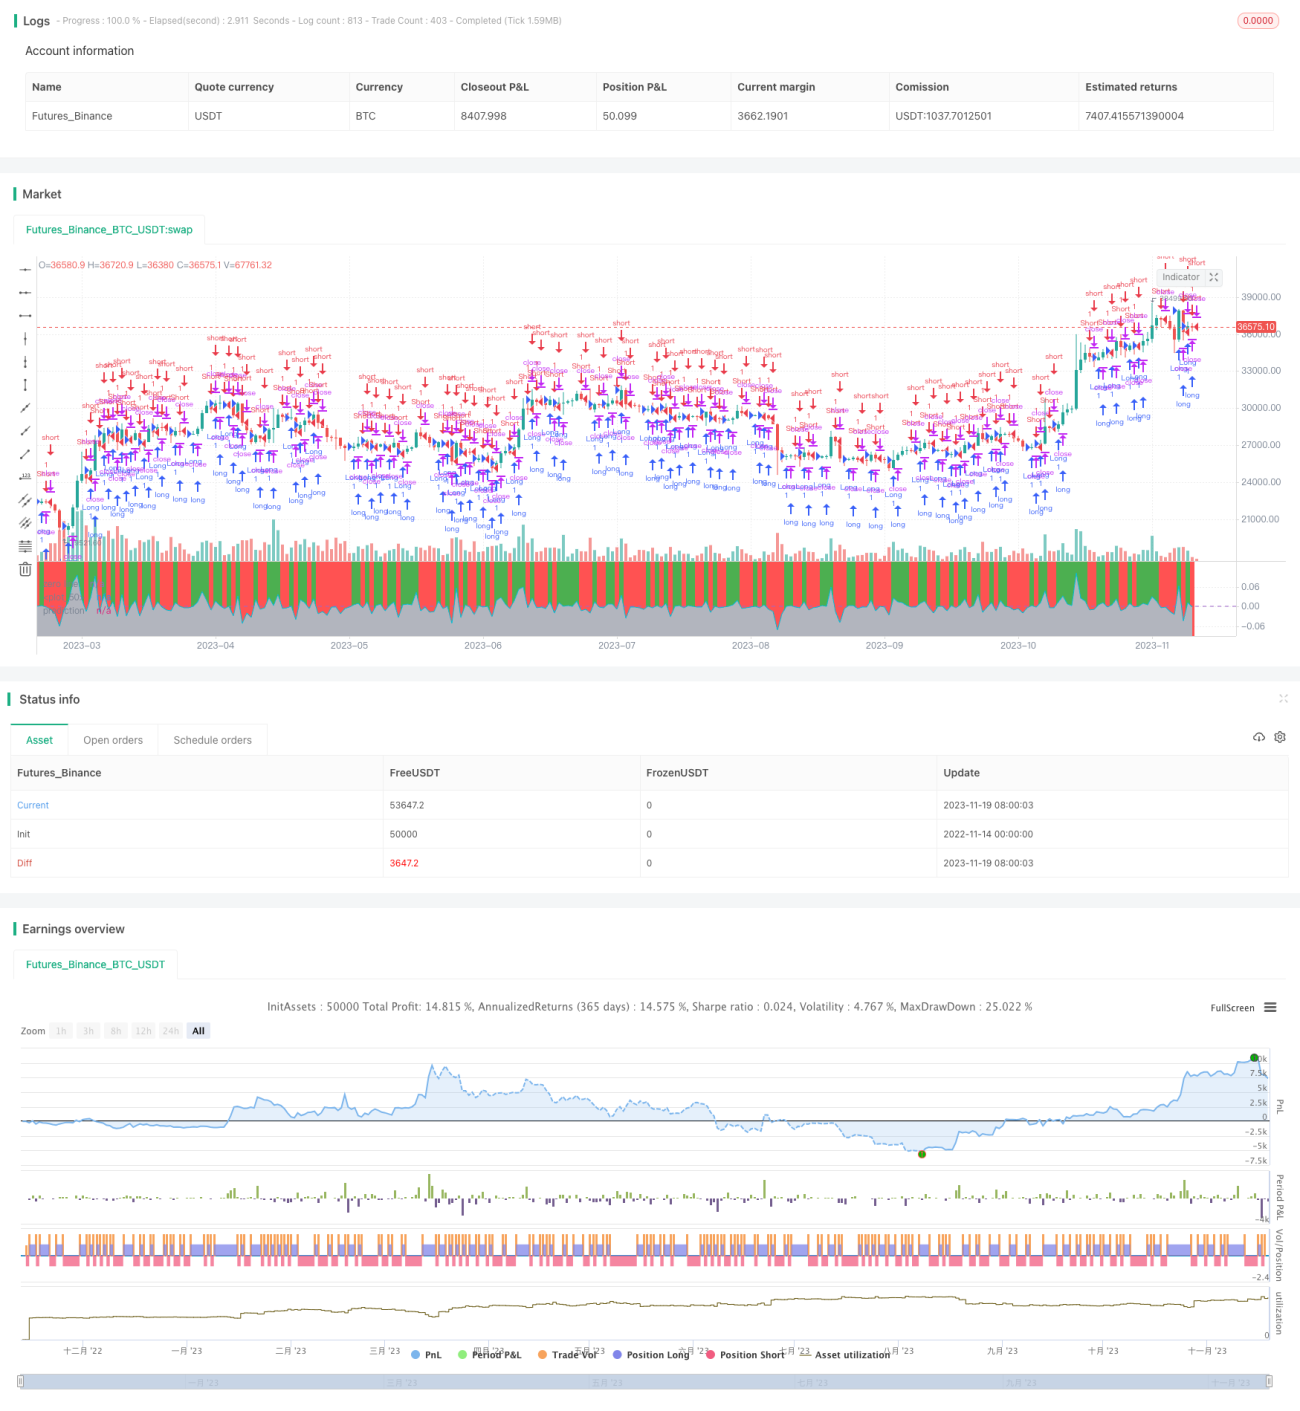
概要
この戦略は,<unk>日線閉店価格比較戦略<unk>と呼ばれ,<unk>日線閉店価格に基づいて取引決定を行う量的な戦略である.この戦略は,現在の<unk>日線閉店価格と前日の<unk>日線閉店価格の差値を計算することによって取引シグナルを生成する.差値が設定された<unk>値を超えると,購入または販売を行う.
戦略原則
この戦略の核心的な論理は,現在のK線の終了価格と,前のK線の終了価格の比較である.
- 現在の日線閉店価格と前日の日線閉店価格の差を計算する (today - yesterday)
- 差値と前日の閉店価格の比率を計算します.
- 割合が設定された正の<unk>値より大きい場合,買い込み信号が発生し,比例が設定された負の<unk>値より小さい場合,売り込み信号が発生します.
- シグナルで入ると多量または空の倉庫位置
この戦略は,止損と停止条件を設定せず,<unk>値条件によって形成される取引信号による入場と平和のポジションを行う.
優位分析
- シンプルで分かりやすい考え方で,量子取引の入門学習に適しています.
- 日経の終盤価格のみをベースに取引し,頻繁に取引を避ける
- 値下げを調整することで取引頻度を制御できます.
リスク分析
- 単一損失をコントロールできない
- 連続した取引信号が起こり,過剰取引が起こる可能性があります.
- 総損失を十分にコントロールできない.
最適化の方向
- ストップロズロジクスを追加し,単一損失を制御します.
- ポジション開設制限を高め,過剰取引を避ける
- パラメータを最適化し,最適な取引頻度を見つけます.
要約する
この戦略は,日経の閉盘価格を比較して取引信号を形成する.考え方はシンプルで,入門学習に適している.しかし,この戦略には一定のリスクがあり,実際の取引のためにさらなる最適化が必要である.
Source
Pine
/*backtest
start: 2022-11-14 00:00:00
end: 2023-11-20 00:00:00
period: 1d
basePeriod: 1h
exchanges: [{"eid":"Futures_Binance","currency":"BTC_USDT"}]
*/

//@version=2
strategy("Daily Close Comparison Strategy (by ChartArt) correct results", shorttitle="CA_-_Daily_Close_Strat", overlay=false)

// ChartArt's Daily Close Comparison StrategyStrategy parameters
Related strategies
Comment
All comments (0)
No data
- 1