RSIとATR経路に基づく超スカルピング戦略
作者: リン・ハーンチャオチャン, 日付: 2023-11-28 15:15:14タグ:
RSIとATRチャネルに基づくスーパースカルピング戦略
概要
この戦略は,スーパースカルピング戦略タイプに属する,5分および15分タイムフレームに適した相対強度指数 (RSI) と平均真の範囲 (ATR) チャネルに基づいています. RSI インディケーターを通じて長/短方向エントリーポイントを決定し,ATR チャネルを使用してストップ損失を設定し,高周波取引を実現します.
戦略原則
- 21 日指数関数移動平均値 (EMA) と 65 日指数移動平均値 (EMA) を使って,主要なトレンド方向を判断し,黄金十字と死十字を形成します.
- RSIが50を下回ると下落し,50を超えると上昇し,買い売り信号を送ります
- ATRチャネルの上部と下部帯は: Close+ATRと Close-ATR. CloseがATRの上部帯を突破すると売り,下部帯を突破すると購入する.
- ストップ・ロスは2倍ATRで 利益は5倍ATRで
利点分析
- 主なトレンドを決定するために黄金十字と死十字を使用し,トレンドに反する取引を避ける.
- RSIはより良い入場タイミングを特定できます
- ATRチャネルはストップ・ロスを設定し 利得ポイントを有効に取ることで 利益-損失比率を大幅に改善します
- 高周波のスカルピングで 迅速な利益を得るのに適しています
リスク分析
- 市場を注意深く観察する必要がある 否則,エントリーまたはストップ損失のポイントを逃すことが 大きな損失につながる可能性があります
- トレンド市場では,複数の追加ポジションが発生し,ポジションのサイズ管理をよくする必要があります.
- 頻繁に取引を行うには十分な資本が必要です.
最適化方向
- ATR パラメータを最適化して,より合理的なストップ・ロストと利益を得ます
- 入力品質を改善するために他の指標フィルターを追加します.
- 自動ストップ損失と 利益関数を追加します
- 資本管理とポジションサイズ管理モジュールを含む.
概要
この戦略は,高周波スカルピングの取引タイプに属している.迅速な取引のためのRSIインジケーターとATRチャネルを通じてエントリーと出口点を設定する.利点は,トレンドに沿って取引に適した良いリスク制御による迅速な利益である.しかし,頻繁な取引をサポートする十分な資本で,緊密な市場監視が必要である.全体的には,この戦略はトレンド取引に良好なパフォーマンスを発揮し,最適化によって収益性をさらに向上させることができる.
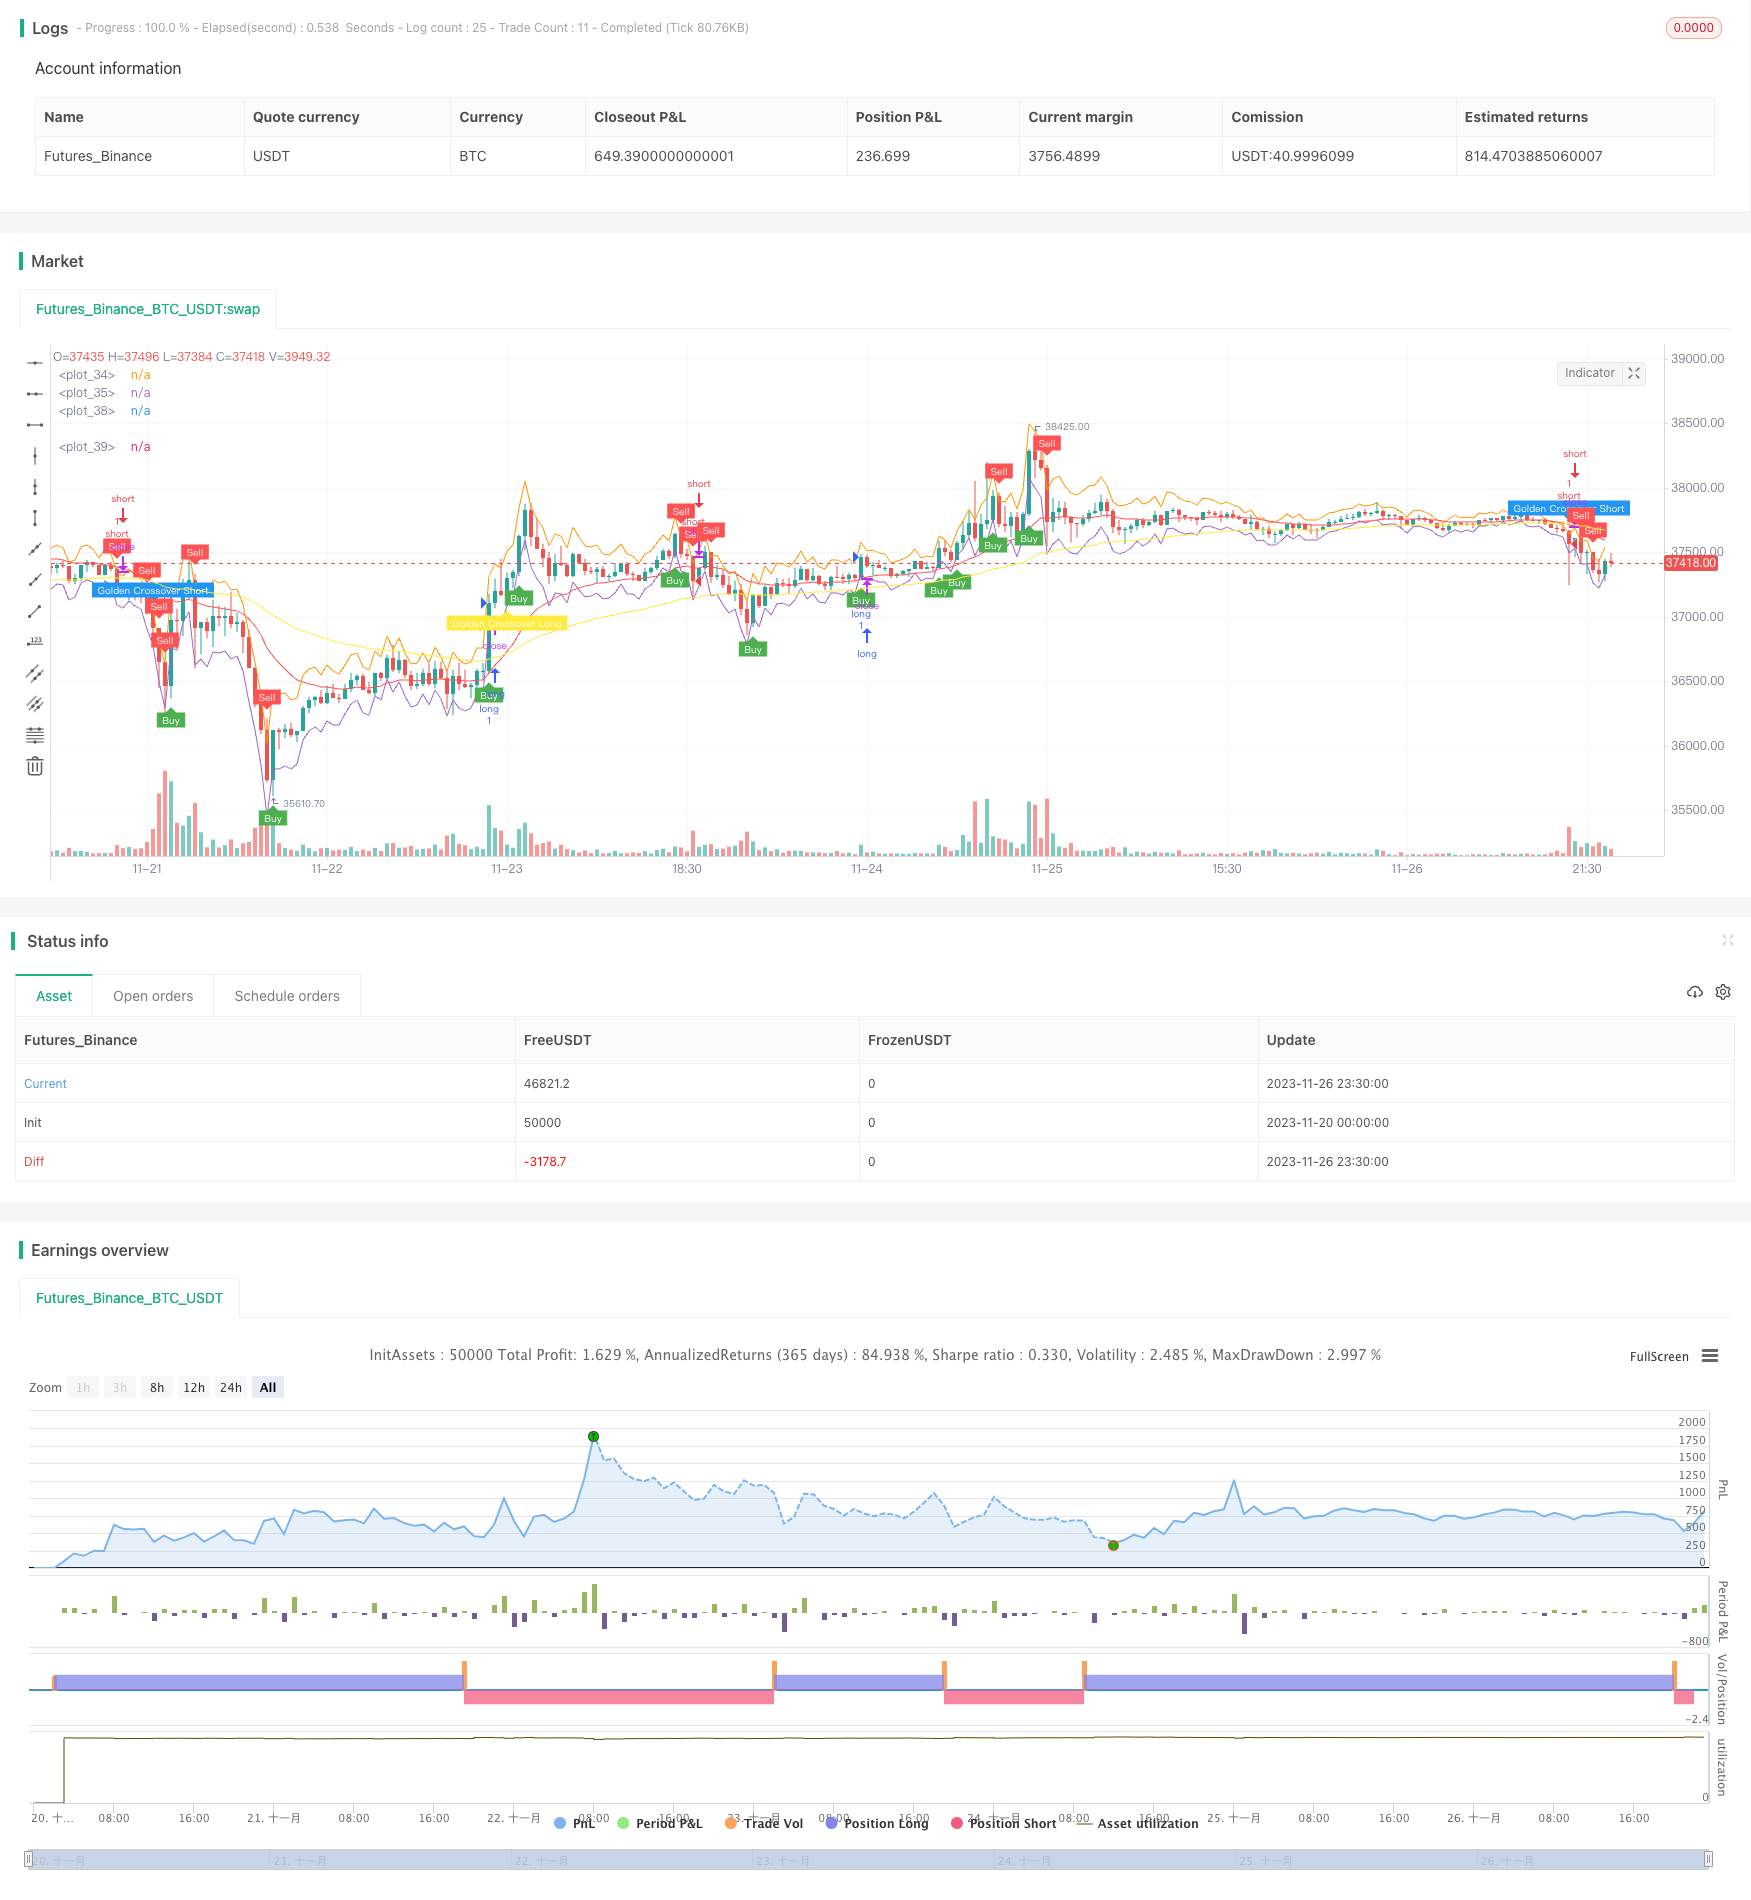
/*backtest
start: 2023-11-20 00:00:00
end: 2023-11-27 00:00:00
period: 30m
basePeriod: 15m
exchanges: [{"eid":"Futures_Binance","currency":"BTC_USDT"}]
*/

//@version=4
strategy("Super Scalper - 5 Min 15 Min", overlay=true)

// Create Indicator's
shortSMA = ema(close, 21)
longSMA = ema(close, 65)
rsi = rsi(close, 14)
atr = atr(14)

// Specify  conditions
longCondition = open < close-atr
shortCondition = open > atr+close
GoldenLong = crossover(shortSMA,longSMA)
Goldenshort = crossover(longSMA,shortSMA)

plotshape(shortCondition, title="Sell Label", text="Sell", location=location.abovebar, style=shape.labeldown, size=size.tiny, color=color.red, textcolor=color.white, transp=0)
plotshape(longCondition, title="Buy Label", text="Buy", location=location.belowbar, style=shape.labelup, size=size.tiny, color=color.green, textcolor=color.white, transp=0)
plotshape(Goldenshort, title="Golden Sell Label", text="Golden Crossover Short", location=location.abovebar, style=shape.labeldown, size=size.tiny, color=color.blue, textcolor=color.white, transp=0)
plotshape(GoldenLong, title="Golden Buy Label", text="Golden Crossover Long", location=location.belowbar, style=shape.labelup, size=size.tiny, color=color.yellow, textcolor=color.white, transp=0)
// Execute trade if condition is True
if (longCondition)
    stopLoss = low - atr * 2
    takeProfit = high + atr * 5
    strategy.entry("long", strategy.long, 1, when = rsi > 50)


if (shortCondition)
    stopLoss = high + atr * 2
    takeProfit = low - atr * 5
    strategy.entry("short", strategy.short, 1, when = rsi < 50)


// Plot ATR bands to chart
plot(atr+close)
plot(close-atr)

// Plot Moving Averages
plot(shortSMA, color = color.red)
plot(longSMA, color = color.yellow)
もっと
- コモディティ・モメントムインデックス戦略
- ダブル・タートル・ブレークスルー戦略
- 波動傾向に基づく定量的な取引戦略
- イチモク・クモ・トウィスト ゴールド吸収戦略
- 部分的な利益を取る戦略でステップアップトラッキングストップ
- Hull TSI と CCI の移動平均傾向追跡戦略
- リバースエンジニアリング RSI 戦略
- 二重のCCI量的な戦略
- 双 EMA クロスオーバー ブレイクアウト 戦略
- マルチタイムフレームMACD戦略
- ドンチアン・トレンド戦略
- マルチSMA移動平均のクロスオーバー戦略
- マルチRSIインジケーター取引戦略
- 超トレンド戦略 ストップ損失を後押しする
- 重度の移動平均のブレイクアウト逆転戦略
- 移動平均相対強度指数戦略
- ADX インテリジェントトレンド追跡戦略
- RSIのモメントマグネレーション戦略
- 価格格差に基づくストップ損失戦略
- 移動平均のブレイクアウト戦略