ダイナミックボラティリティキャプチャーRSI-ボリンジャーバンド戦略


作成日: 2023-12-01 14:17:55 最終変更日: 2023-12-01 14:17:55
コピー: 0 クリック数: 751
1
フォロー
1619
フォロワー

ダイナミックボラティリティキャプチャーRSI-ボリンジャーバンド戦略

概要

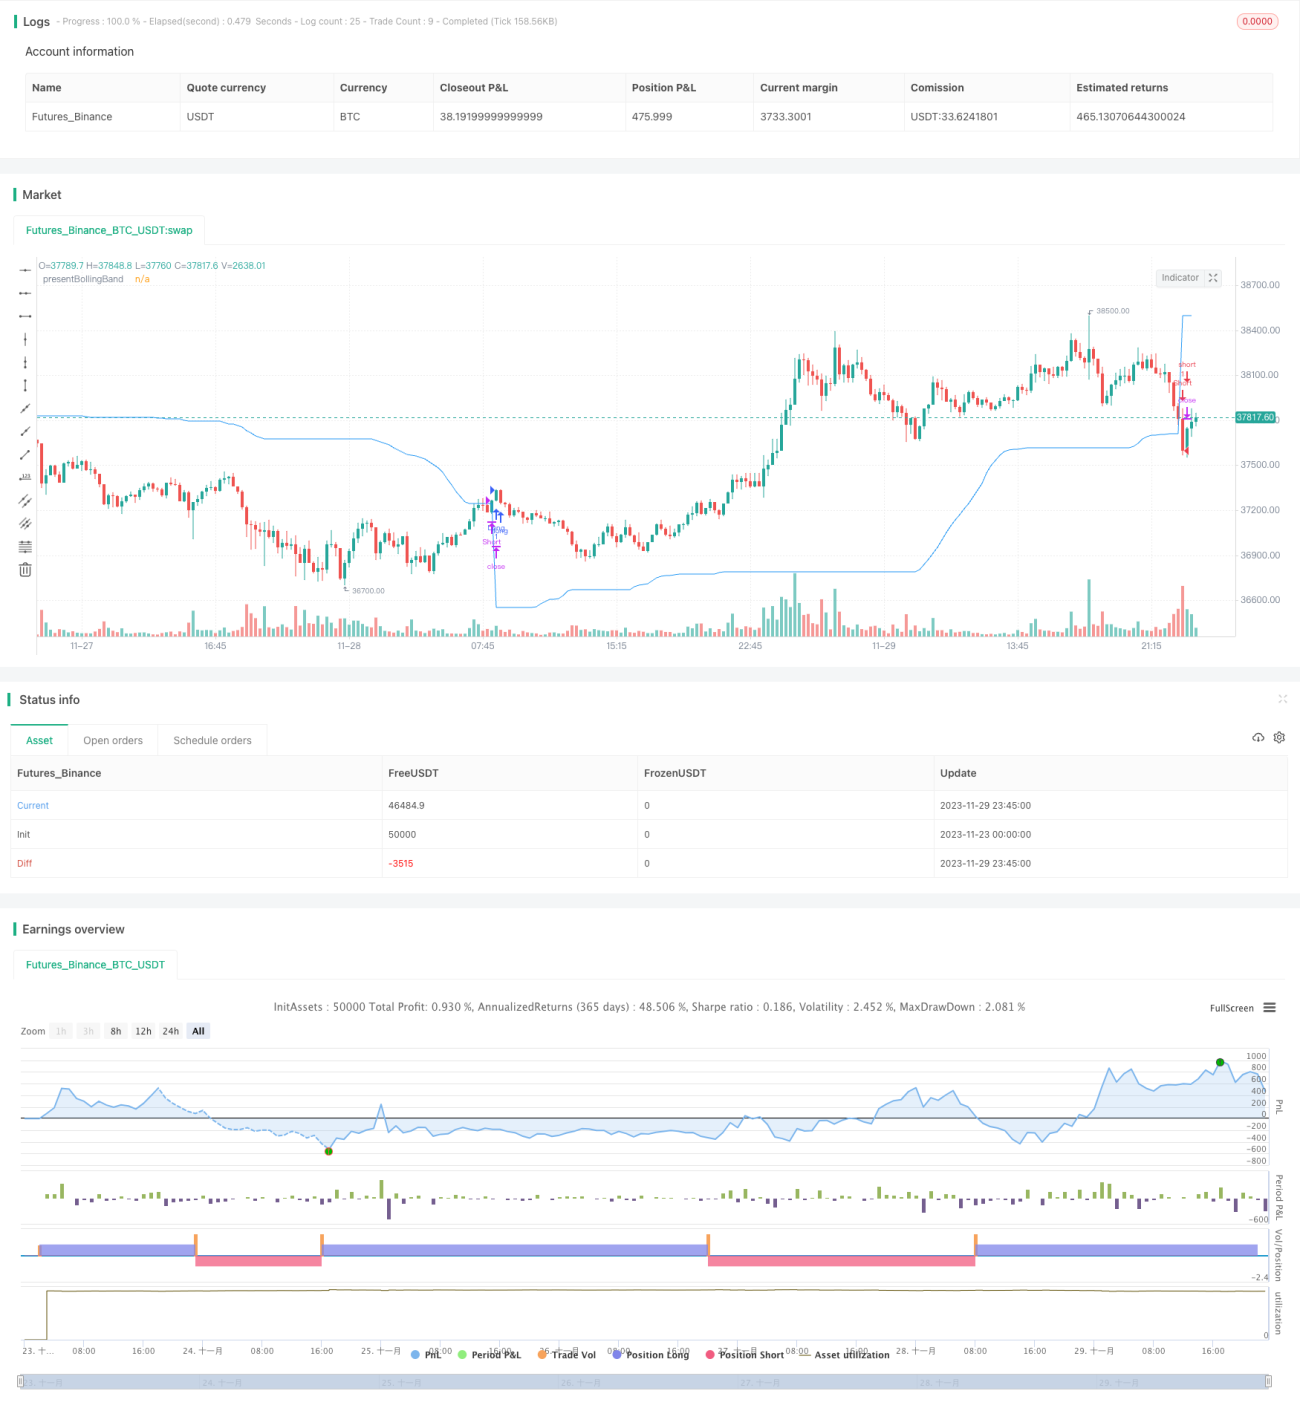
ダイナミック波幅捕捉RSI-ブリン帯戦略は,ブリン帯 ((BB),相対的に強い指標 ((RSI) と単純な移動平均 ((SMA) の理念を統合した取引戦略である.この戦略のユニークな点は,上線と下線の終了価格に基づいて動的レベルを計算することです.このユニークな機能は,この戦略を市場の変動と価格の変化に適応させています.

仮想通貨と株式市場は高度に変動するので,ブリン・バンド戦略を適用することが非常に適しています. RSIは,このよく投機的な市場の過剰買いや過剰売り状況を識別するのに役立ちます.

戦略原則

動的ブリン帯:この戦略は,まず,ユーザが定義した長さと倍数に基づいて上線と下線ブリン帯を計算する。それから,ブリン帯と閉じる価格の動的調整のpresentBollingBandの値を組み合わせる。最後に,価格がpresentBollingBandを横切るときに多信号を生成し,価格がpresentBollingBandを横切るときに空信号を生成する。

RSI:ユーザがRSIでシグナルを生成することを選択した場合,この策略はRSIとそのSMAを計算し,それらを使用して追加の多行および短行シグナルを生成します. RSIでシグナルを生成するの選択がtrueに設定されている場合にのみ,RSIベースのシグナルを使用します.

その後,この戦略は選択した取引方向をチェックし,それに応じて多引または空白のポジションに入ります.取引方向が双方向のに設定されている場合,この戦略は多引および空白のポジションに同時に入ることができます.

最後に,閉店価格がpresent BollingBandを横切るときは,多取引として平らげます.閉店価格がpresent BollingBandを横切るときは,空売りとして平らげます.

優位分析

この戦略はブリン帯,RSI,SMAの優位性を組み合わせて,市場の波動に適応し,波動をダイナミックに捉え,過剰買いや過剰販売の場合には取引シグナルを生成します.

RSIはブリン帯の取引信号を補完し,波動的な市場での誤入場を避ける. 多額,空白または双方向取引の選択を許容し,異なる市場条件に適応する.

パラメータはカスタマイズされ,個人のリスクの好みに合わせて調整できます.

リスク分析

この戦略は技術指標に依存しており,基本面による大きな転換に対応できない.

ブリン帯のパラメータ設定が不適切である場合,取引信号が頻度か稀度に発生する可能性があります.

バイ・ウェイ・トレードでリスクが高くなり,マイナス・オフショート・損失に注意が必要です.

リスク管理には,ストップ・ローズを組み合わせるのがお勧めです.

最適化の方向

  1. MACD等の他の指標のフィルタリング信号と組み合わせる.

  2. ストップ・ロスの策略を増やすこと

  3. ブリン帯とRSIのパラメータを最適化する.

  4. 異なる取引品種と周期に応じてパラメータを調整する.

  5. リアルディスクの最適化を考慮し,実際の状況に合わせてパラメータを調整する.

要約する

動的波幅捕捉RSI-ブリン帯戦略は,ブリン帯,RSI,SMA指標の優位性を組み合わせ,ブリン帯,RSI,SMA指標の優位性を組み合わせて,ブリンを動的に調整して市場の波動を捕捉する戦略である.この戦略は,カスタマイズして最適化できるスペースは大きいが,基本面の変化を予測することはできません.実況テスト効果を推奨し,必要に応じてパラメータを調整するか,他の指標と組み合わせて追加して使用し,リスクを軽減します.

ストラテジーソースコード
/*backtest
start: 2023-11-23 00:00:00
end: 2023-11-30 00:00:00
period: 15m
basePeriod: 5m
exchanges: [{"eid":"Futures_Binance","currency":"BTC_USDT"}]
*/

// This source code is subject to the terms of the Mozilla Public License 2.0 at https://mozilla.org/MPL/2.0/
// © PresentTrading

//@version=5
// Define the strategy settings
strategy('Volatility Capture RSI-Bollinger - Strategy [presentTrading]', overlay=true)

// Define the input parameters for the indicator
priceSource  = input.source(title='Source', defval=hlc3, group='presentBollingBand') // The price source to use
lengthParam   = input.int(50, 'lengthParam', minval=1, group='presentBollingBand') // The length of the moving average
multiplier = input.float(2.7183, 'Multiplier', minval=0.1, step=.1, group='presentBollingBand') // The multiplier for the ATR
useRSI = input.bool(true, 'Use RSI for signals', group='presentBollingBand') // Boolean input to decide whether to use RSI for signals
rsiPeriod = input.int(10, 'RSI Period', minval=1, group='presentBollingBand') // The period for the RSI calculation
smaPeriod = input.int(5, 'SMA Period', minval=1, group='presentBollingBand') // The period for the SMA calculation
boughtRange = input.float(55, 'Bought Range Level', minval=1, group='presentBollingBand') // The level for the bought range
soldRange = input.float(50, 'Sold Range Level', minval=1, group='presentBollingBand') // The level for the sold range

// Add a parameter for choosing Long or Short
tradeDirection = input.string("Both", "Trade Direction", options=["Long", "Short", "Both"], group='presentBollingBand') // Dropdown input for trade direction

// Calculate the bollingerBand
barIndex = bar_index // The current bar index
upperBollingerBand = ta.sma(high, lengthParam) + ta.stdev(high, lengthParam) * multiplier // Calculate the upper Bollinger Band
lowerBollingerBand = ta.sma(low, lengthParam) - ta.stdev(low, lengthParam) * multiplier // Calculate the lower Bollinger Band

var float presentBollingBand = na // Initialize the presentBollingBand variable
crossCount = 0 // Initialize the crossCount variable

// Calculate the buy and sell signals
longSignal1 = ta.crossover(priceSource, presentBollingBand) // Calculate the long signal
shortSignal1 = ta.crossunder(priceSource, presentBollingBand) // Calculate the short signal

// Calculate the RSI
rsiValue = ta.rsi(priceSource, rsiPeriod) // Calculate the RSI value
rsiSmaValue = ta.sma(rsiValue, smaPeriod) // Calculate the SMA of the RSI value

// Calculate the buy and sell signals
longSignal2 = rsiSmaValue > boughtRange // Calculate the long signal based on the RSI SMA
shortSignal2 = rsiSmaValue < soldRange // Calculate the short signal based on the RSI SMA

presentBollingBand := na(lowerBollingerBand) or na(upperBollingerBand)?0.0 : close>presentBollingBand?math.max(presentBollingBand,lowerBollingerBand) : close<presentBollingBand?math.min(presentBollingBand,upperBollingerBand) : 0.0


if (tradeDirection == "Long" or tradeDirection == "Both") and longSignal1 and (useRSI ? longSignal2 : true) // Use RSI for signals if useRSI is true
    presentBollingBand := lowerBollingerBand // If the trade direction is "Long" or "Both", and the long signal is true, and either useRSI is false or the long signal based on RSI is true, then assign the lowerBollingerBand to the presentBollingBand.
    strategy.entry("Long", strategy.long) // Enter a long position.

if (tradeDirection == "Short" or tradeDirection == "Both") and shortSignal1 and (useRSI ? shortSignal2 : true) // Use RSI for signals if useRSI is true
    presentBollingBand := upperBollingerBand // If the trade direction is "Short" or "Both", and the short signal is true, and either useRSI is false or the short signal based on RSI is true, then assign the upperBollingerBand to the presentBollingBand.
    strategy.entry("Short", strategy.short) // Enter a short position.

// Exit condition
if (strategy.position_size > 0 and ta.crossunder(close, presentBollingBand)) // If the strategy has a long position and the close price crosses under the presentBollingBand, then close the long position.
    strategy.close("Long")
if (strategy.position_size < 0 and ta.crossover(close, presentBollingBand)) // If the strategy has a short position and the close price crosses over the presentBollingBand, then close the short position.
    strategy.close("Short")

//~~ Plot
plot(presentBollingBand,"presentBollingBand", color=color.blue) // Plot the presentBollingBand on the chart.