ゴールデンクロスとデスクロスのダブル移動平均取引戦略


作成日: 2023-12-01 14:36:33 最終変更日: 2023-12-01 14:36:33
コピー: 9 クリック数: 617
1
フォロー
1621
フォロワー

ゴールデンクロスとデスクロスのダブル移動平均取引戦略

概要

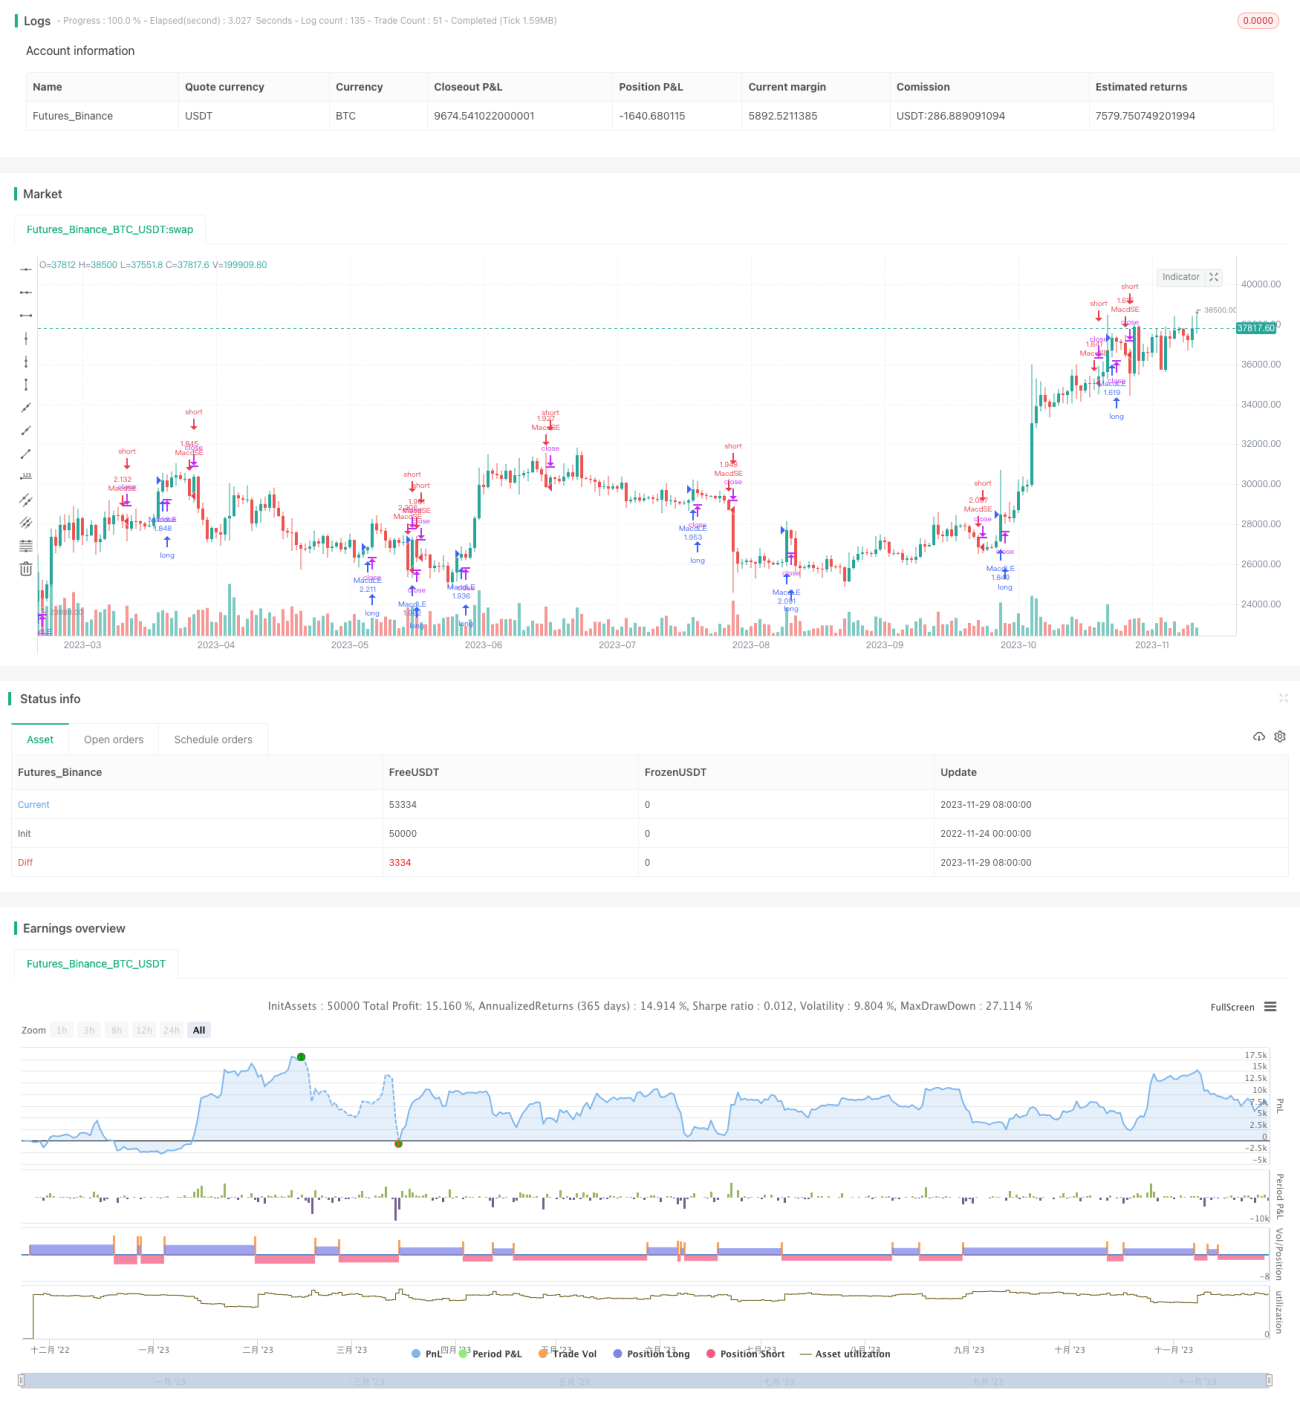
双均線取引戦略は,異なる周期の指数移動平均を計算し,快線と遅線を形成し,それらの金叉と死叉の形状を観察して取引信号を生成する. 快線が下から遅線を貫くとき,多行し,快線が上から下から遅線を貫くとき,空行する. この戦略は,均線のトレンド反転点を捕捉し,より一般的なトレンド追跡戦略である.

戦略原則

双均線取引戦略の核心指標は,快線と慢線を計算することである.快線は,短周期の指数移動平均を指し,デフォルトパラメータは12日線である.慢線は,長周期の指数移動平均を指し,デフォルトパラメータは26日線である.指数移動平均の計算式は次のとおりである.

EMA(t) = (C(t) - EMA(t-1)) * SF + EMA(t-1)

その中,C (t) は当日の閉盘価格であり,SFはスムージングファクターである.指数移動平均は,通常算数移動平均と異なるのは,指数移動平均は,最近のデータにより大きな重みを与え,価格の変化により迅速に反応できる点にある.

取引規則は以下の通りです.

  • 高速線が低速線を下から切るとき,ゴールデン・クロス・ゴールド・フォークが形成され,多入場が行われます.
  • 速線が上から下を通過すると,デッドクロスが形成され,空き場が作られる.
  • 速線と慢線が離れる時,平仓は出場する.

均線の交差形状をキャプチャで監視し,市場需要と供給の関係とトレンドの変化に適時に対応し,収益性を実現する.

優位分析

双均線取引戦略は,より成熟した技術指標戦略として,以下の利点があります.

  1. 思考が明確で,理解しやすく,実行可能である.
  2. 市場における需要と供給の関係を正確に判断し, 高い得点率で判断する.
  3. 市場騒音を効果的にフィルターし,主要トレンドを捉える.
  4. 異なる市場や時間枠で適用できる
  5. 戦略を豊かにするために,他の技術指標と組み合わせることができます.
  6. 資金活用率が高いため,大きな資金需要に対応しています.

リスク分析

双方向の取引戦略には,いくつかの欠陥とリスクがあります.

  1. 市場が急激に成長する中で,
  2. 偽の信号や頻繁に起こる小さな振動が,密集した取引を誘発する.
  3. 異なる品種と時間周期に対応するためにパラメータを最適化する必要があります.
  4. 逆に,その傾向が逆転する合理的な位置を判断できない.

上記のリスクに対して,均線周期パラメータの調整,追加フィルターの導入などの方法によって最適化することができ,戦略がより堅牢であることを保証する.

最適化の方向

双方向の取引戦略は,以下の点で最適化できます.

  1. 弱点の変動の誤った取引を避けるために,強弱のトレンドを判断するMACD指標を導入する.
  2. トレンドの逆転を防ぐために,確認指標として取引量を増加させる.
  3. ブリン線,K線などの他の技術指標と組み合わせて,より正確な入場・退場条件を設定する.
  4. LSTMのような機械学習の方法を利用して,平均線パラメータを自動的に最適化して,より良い市場適応性を実現する.

要約する

双均線取引戦略は,均線の金叉と死叉の取引機会を捕捉し,価格傾向の逆転点を判断し,安定した収益を実現する.この戦略の優点は,簡潔で明快で,資金効率が高いことであり,量化入門の第一の戦略である.しかし,偽信号を生成するなど,より多くの指標を導入して最適化する必要があり,特定の品種と取引環境に適したように作られる.全体的に,双均線取引戦略は,非常に実用的な技術指標戦略である.

ストラテジーソースコード
/*backtest
start: 2022-11-24 00:00:00
end: 2023-11-30 00:00:00
period: 1d
basePeriod: 1h
exchanges: [{"eid":"Futures_Binance","currency":"BTC_USDT"}]
*/

// This source code is subject to the terms of the Mozilla Public License 2.0 at https://mozilla.org/MPL/2.0/
// © antondmt

//@version=5
strategy("Returns & Drawdowns Table", "R & DD", true, calc_on_every_tick = false, default_qty_type = strategy.percent_of_equity, default_qty_value = 100, process_orders_on_close = true)
i_eq_to_dd =            input.string("Compound Equity", "Mode", ["Simple Equity", "Compound Equity", "Drawdown"], group = "R & DD Table")
i_precision =           input.int(2, "Return Precision", group = "R & DD Table")
i_headers_col =         input.color(#D4D4D4, "Headers Color", group = "R & DD Table")
i_headers_text_col =    input.color(color.black, "Headers Text Color", group = "R & DD Table")
i_pos_col =             input.color(color.green, "Positive Color", group = "R & DD Table")
i_neg_col =             input.color(color.red, "Negative Color", group = "R & DD Table")
i_zero_col =            input.color(#DDDDDD, "Zero Color", group = "R & DD Table")
i_cell_text_col =       input.color(color.white, "Cell Text Color", group = "R & DD Table")

// TIME {
var month_times = array.new_int(0)                                                              // Array of all month times  
new_month = month(time) != month(time[1]) 
if(new_month or barstate.isfirst)
    array.push(month_times, time)

var year_times = array.new_int(0)                                                               
new_year = year(time) != year(time[1])  
if (new_year or barstate.isfirst)
    array.push(year_times, time)
//}

// SIMPLE EQUITY CALCULATIONS {
// Simple equity is strictly calculated from start to end of each month/year equity. There is no compound
var monthly_simp_pnls = array.new_float(0)                                                      // Array of all monthly profits and losses
var yearly_simp_pnls = array.new_float(0)                                                       

if(i_eq_to_dd == "Simple Equity")
    var initial_monthly_equity = strategy.equity                                                // Starting equity for each month
    cur_month_pnl = nz((strategy.equity - initial_monthly_equity) / initial_monthly_equity)     // Current month's equity change
    if(new_month or barstate.isfirst)
        initial_monthly_equity := strategy.equity
        array.push(monthly_simp_pnls, cur_month_pnl)
    else 
        array.set(monthly_simp_pnls, array.size(monthly_simp_pnls) - 1, cur_month_pnl)
    
    var initial_yearly_equity = strategy.equity
    cur_year_pnl = nz((strategy.equity - initial_yearly_equity) / initial_yearly_equity)
    if (new_year or barstate.isfirst)
        initial_yearly_equity := strategy.equity
        array.push(yearly_simp_pnls, cur_year_pnl)
    else 
        array.set(yearly_simp_pnls, array.size(yearly_simp_pnls) - 1, cur_year_pnl)
// }

// COMPOUND EQUITY CALCULATIONS {
// Compound equity is strictly calculated based on equity state from the beginning of time until the end of each month/year equity. It shows the exact equity movement through time
var monthly_comp_pnls = array.new_float(0)                                                      // Array of all monthly profits and losses
var yearly_comp_pnls = array.new_float(0)                                                       

if(i_eq_to_dd == "Compound Equity")
    var initial_equity = strategy.equity                                                
    cur_month_pnl = nz((strategy.equity - initial_equity) / initial_equity)                     // Current month's equity change
    if(new_month or barstate.isfirst)
        array.push(monthly_comp_pnls, cur_month_pnl)
    else 
        array.set(monthly_comp_pnls, array.size(monthly_comp_pnls) - 1, cur_month_pnl)
    
    cur_year_pnl = nz((strategy.equity - initial_equity) / initial_equity)
    if (new_year or barstate.isfirst)
        array.push(yearly_comp_pnls, cur_year_pnl)
    else 
        array.set(yearly_comp_pnls, array.size(yearly_comp_pnls) - 1, cur_year_pnl)
// }
    
// DRAWDOWN CALCULATIONS {
// Drawdowns are calculated from highest equity to lowest trough for the month/year
var monthly_dds = array.new_float(0)                                                            // Array of all monthly drawdowns
var yearly_dds = array.new_float(0)                                                             

if (i_eq_to_dd == "Drawdown")
    total_equity = strategy.equity - strategy.openprofit                        
    
    var cur_month_dd = 0.0  
    var m_ATH = total_equity                                                                    // Monthly All-Time-High (ATH). It is reset each month
    m_ATH := math.max(total_equity, nz(m_ATH[1]))
    m_drawdown = -math.abs(total_equity / m_ATH * 100 - 100) / 100                              // Drawdown at current bar
    if(m_drawdown < cur_month_dd)
        cur_month_dd := m_drawdown
    if(new_month or barstate.isfirst)
        cur_month_dd := 0.0
        m_ATH := strategy.equity - strategy.openprofit
        array.push(monthly_dds, 0)
    else 
        array.set(monthly_dds, array.size(monthly_dds) - 1, cur_month_dd)
    
    var cur_year_dd = 0.0
    var y_ATH = total_equity
    y_ATH := math.max(total_equity, nz(y_ATH[1]))
    y_drawdown = -math.abs(total_equity / y_ATH * 100 - 100) / 100
    if(y_drawdown < cur_year_dd)
        cur_year_dd := y_drawdown
    if (new_year or barstate.isfirst)
        cur_year_dd := 0.0
        y_ATH := strategy.equity - strategy.openprofit
        array.push(yearly_dds, 0)
    else 
        array.set(yearly_dds, array.size(yearly_dds) - 1, cur_year_dd) 
// }

// TABLE LOGIC { 
var main_table = table(na)
table.clear(main_table, 0, 0, 13, new_year ? array.size(year_times) - 1 : array.size(year_times))
main_table := table.new(position.bottom_right, columns = 14, rows = array.size(year_times) + 1, border_width = 1)

t_set_headers() =>                                                                              // Sets time headers of the table
    // Set month headers
    table.cell(main_table, 0,  0, "",     text_color = i_headers_text_col, bgcolor = i_headers_col)
    table.cell(main_table, 1,  0, "Jan",  text_color = i_headers_text_col, bgcolor = i_headers_col)
    table.cell(main_table, 2,  0, "Feb",  text_color = i_headers_text_col, bgcolor = i_headers_col)
    table.cell(main_table, 3,  0, "Mar",  text_color = i_headers_text_col, bgcolor = i_headers_col)
    table.cell(main_table, 4,  0, "Apr",  text_color = i_headers_text_col, bgcolor = i_headers_col)
    table.cell(main_table, 5,  0, "May",  text_color = i_headers_text_col, bgcolor = i_headers_col)
    table.cell(main_table, 6,  0, "Jun",  text_color = i_headers_text_col, bgcolor = i_headers_col)
    table.cell(main_table, 7,  0, "Jul",  text_color = i_headers_text_col, bgcolor = i_headers_col)
    table.cell(main_table, 8,  0, "Aug",  text_color = i_headers_text_col, bgcolor = i_headers_col)
    table.cell(main_table, 9,  0, "Sep",  text_color = i_headers_text_col, bgcolor = i_headers_col)
    table.cell(main_table, 10, 0, "Oct",  text_color = i_headers_text_col, bgcolor = i_headers_col)
    table.cell(main_table, 11, 0, "Nov",  text_color = i_headers_text_col, bgcolor = i_headers_col)
    table.cell(main_table, 12, 0, "Dec",  text_color = i_headers_text_col, bgcolor = i_headers_col)
    table.cell(main_table, 13, 0, str.tostring(i_eq_to_dd), text_color = i_headers_text_col, bgcolor = i_headers_col)

    // Set year headers
    for i = 0 to array.size(year_times) - 1
        table.cell(main_table, 0,  i + 1, str.tostring(year(array.get(year_times, i))), text_color = i_headers_text_col, bgcolor = i_headers_col)

t_set_months() =>                                                                               // Sets inner monthly data of the table
    display_array = switch i_eq_to_dd 
        "Simple Equity" => monthly_simp_pnls 
        "Compound Equity" => monthly_comp_pnls
        => monthly_dds
    for i = 0 to array.size(month_times) - 1
        m_row = year(array.get(month_times, i)) - year(array.get(year_times, 0)) + 1
        m_col = month(array.get(month_times, i)) 
        m_color = array.get(display_array, i) == 0 ? color.new(i_zero_col, transp = 30) : array.get(display_array, i) > 0 ? color.new(i_pos_col, transp = 30) : color.new(i_neg_col, transp = 30)
        table.cell(main_table, m_col, m_row, str.tostring(math.round(array.get(display_array, i) * 100, i_precision)), bgcolor = m_color, text_color = i_cell_text_col)
        
t_set_years() =>                                                                                // Sets inner yearly data of the table
    display_array = switch i_eq_to_dd 
        "Simple Equity" => yearly_simp_pnls 
        "Compound Equity" => yearly_comp_pnls
        => yearly_dds
    for i = 0 to array.size(year_times) - 1
        y_color = array.get(display_array, i) == 0 ? color.new(i_zero_col, transp = 30) : array.get(display_array, i) > 0 ? color.new(i_pos_col, transp = 20) : color.new(i_neg_col, transp = 20)
        table.cell(main_table, 13, i + 1, str.tostring(math.round(array.get(display_array, i) * 100, i_precision)), bgcolor = y_color, text_color = i_cell_text_col)

t_set_headers() 
t_set_months()
t_set_years()
// }

// PLACE YOUR STRATEGY CODE HERE {
// This is a sample code of a working strategy to show the table in action
fastLength = input(12)
slowlength = input(26)
MACDLength = input(9)
MACD = ta.ema(close, fastLength) - ta.ema(close, slowlength)
aMACD = ta.ema(MACD, MACDLength)
delta = MACD - aMACD
if (ta.crossover(delta, 0))
	strategy.entry("MacdLE", strategy.long, comment = "MacdLE")
if (ta.crossunder(delta, 0))
	strategy.entry("MacdSE", strategy.short, comment = "MacdSE")
// }