価格変動に基づくトレンドフォロー型ストップロス戦略

1
Follow
1779
Followers
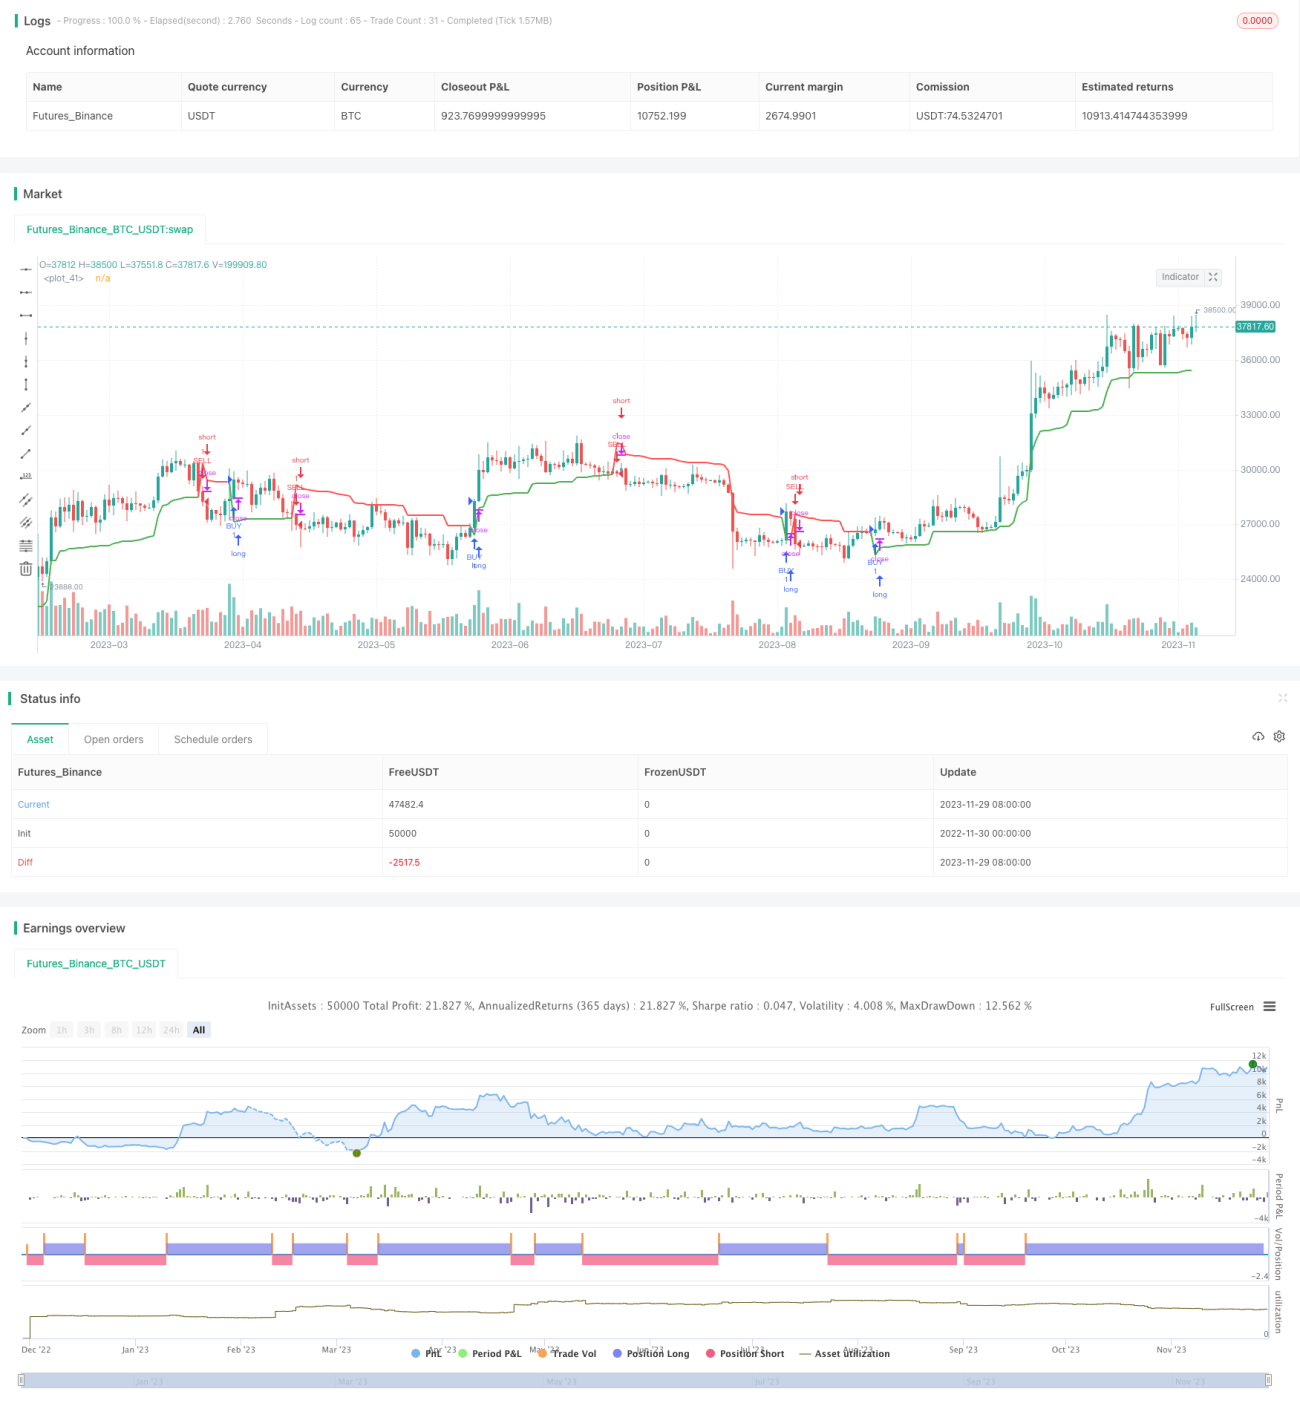
概要
この戦略は,価格の変動性に基づくトレンド追跡ストップ・ロッド戦略である.これは,価格の変動のストップ・ラインを設定するために,平均実際の変動幅 (ATR) を利用する.ATRは,価格の変動性とリスクのレベルを反映する.価格がストップ・ラインを超えると,この戦略は,トレンドが逆転していると判断し,それに応じて開口またはストップ・ロッドの操作を行う.
戦略原則
この戦略は,まず,一定の周期における平均実際の波動幅のATRを計算する.そして,現在の価格トレンドの方向に応じて,上昇傾向の場合,ストップラインを現在の最高価格減減のn倍のATRに設定する.下降傾向の場合,ストップラインを現在の最低価格加のn倍のATRに設定する.この中のn値は,ストップラインと価格の距離を制御するためにパラメータで調整することができる.
価格が上昇傾向のストップラインを下回るか,下降傾向のストップラインを突破すると,トレンドの転換が起きたと判断する.この時,ストップをクリアし,新しいトレンドの方向に応じて新しいストップラインを設定する.
全体として,この戦略は,価格の変動を利用してストップラインを設定し,トレンドの転換を正確に判断する能力を実現しています.トレンドが変化するときに,タイムリーでストップすることは,新しいトレンドの方向を把握するのに役立ちます.
戦略的優位性
- 価格変動の特徴を利用してトレンドを判断し,価格の転換点を正確に把握する
- 市場逆転のリスクを減らすために,時効でポジションを停止し,切り替える
- パラメータ調整の柔軟性により,ストップラインと価格変動の距離を制御できます.
- 特定の品種のパラメータに応じて調整可能で,強い適応性
戦略リスク
- 不効突破による誤判リスク. 価格が持続不能な不効突破が発生し,誤判傾向の転換を引き起こす可能性がある.
- パラメータを極端に設定すると,損失が増加する可能性があります.例えば,n値が大きすぎるとストップラインが近すぎると,小さな振動が引き起こされる可能性があります.
- urrenciesなどの低波動性の品種は,ストップ効果が良くないかもしれない.ATR値が小さい場合,ストップラインは価格に近い
戦略の最適化
- 取引量や波動の加速などの補助指標を導入して,無効突破の誤判を回避できます.
- n の値を異なる品種の特性に応じて調整して,止損距離を適当にします.
- ATR周期は,価格差の変動率を判断するのに最適な周期パラメータを選択して最適化することもできます.
要約する
この戦略は,全体的に見ると,価格変動に基づくストップライン設定のアルゴリズムの実現である.価格の動きを判断する精度が高いため,トレンドの重要な転換点を捉えることができる.同時に,調整するための一定のパラメータのスペースを提供し,適応性が強い.ストップ戦略として,反転のリスクを効果的に回避できるため,現場で適用する価値があります.
Source
Pine
Strategy parameters
Related strategies
Comment
All comments (0)
No data
- 1