ダブル移動平均クロスオーバー戦略

1
Follow
1779
Followers
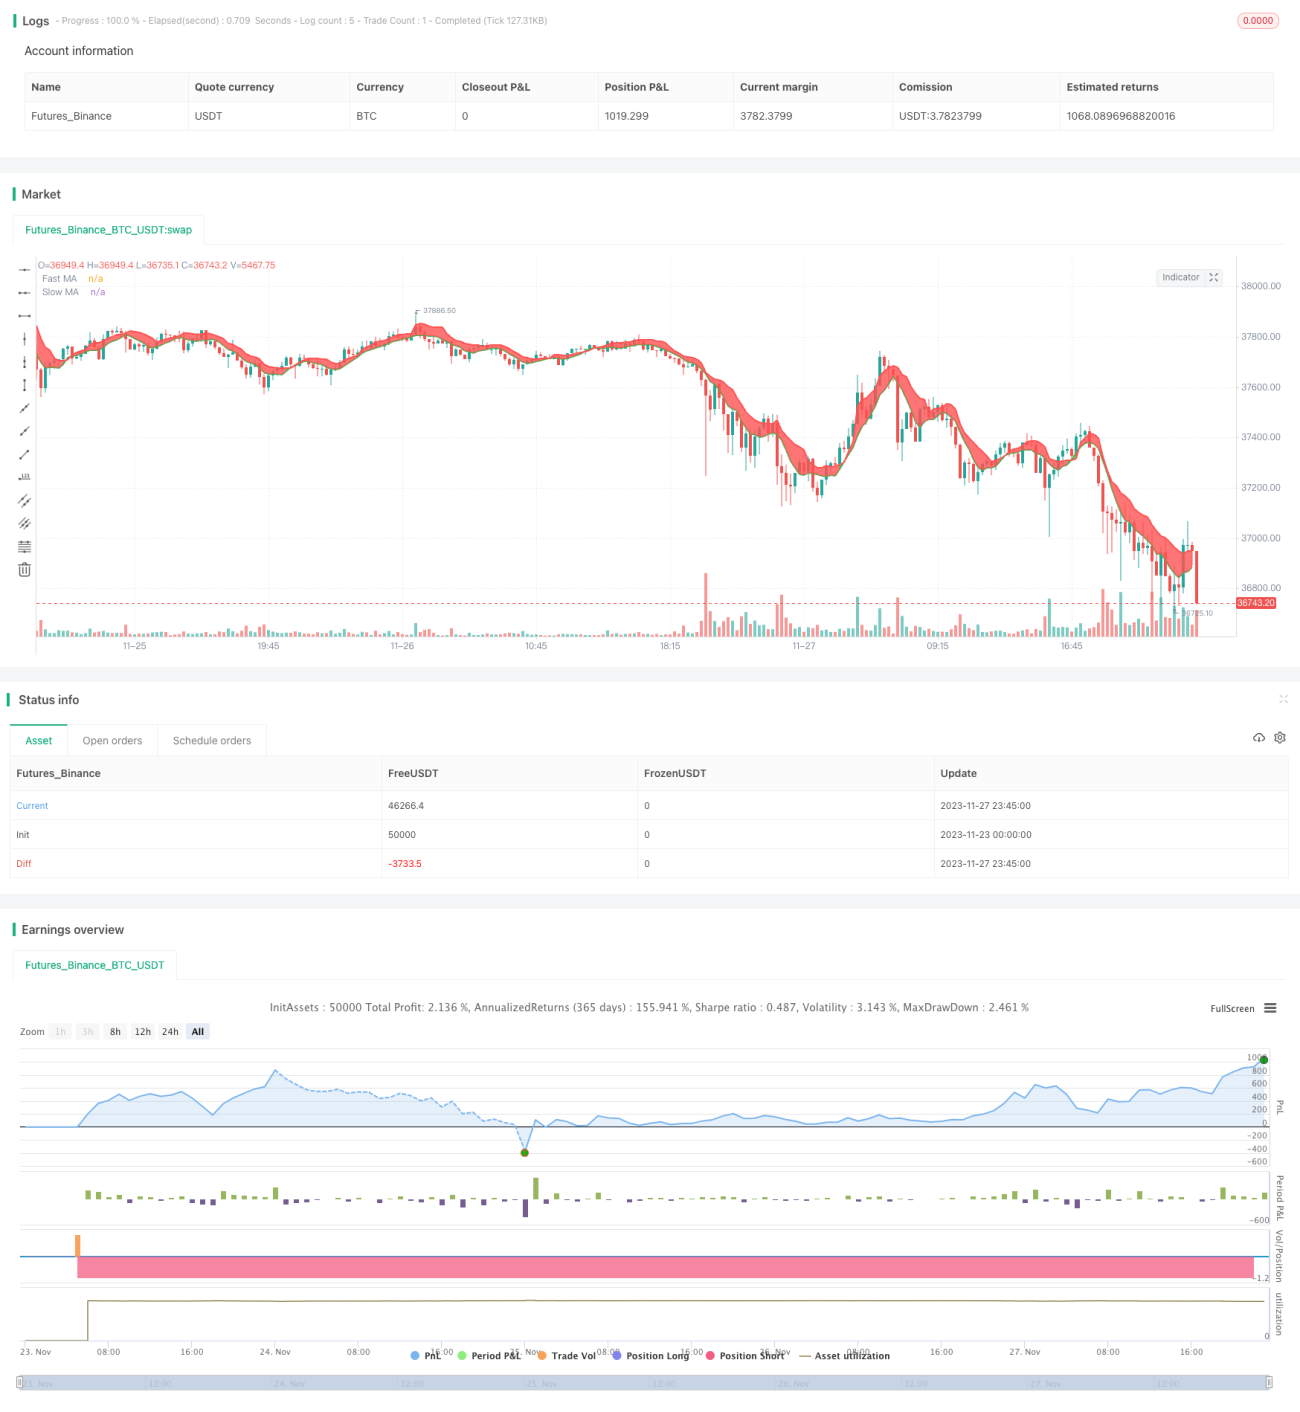
概要
この戦略は,二重平均線交差に基づくトレンド追跡戦略である.それは,迅速なシンプル移動平均 ((SMA)) とゆっくりとした重み付けの移動平均 ((VWMA) を組み合わせて,2つの平均線の交差を利用して,買入と売却のシグナルを形成する.
速いSMAがゆっくりVWMAを上向きに通過すると,買いのシグナルが生成され,速いSMAがゆっくりVWMAを下向きに通過すると,売りのシグナルが生成されます. 戦略は,ストップ・ロスのメカニズムを使用してリスクを制御します.
戦略原則
この戦略の核心的な論理は,二重均線交差系に基づいています.具体的には,以下の技術指標を同時に使用しています.
- 単純移動平均 ((SMA):近日n日の閉店価格の算術平均を取って,近期間の平均価格を反映する.
- 重量移動平均 ((VWMA):最近n日の閉盘価格の重量移動平均,近期価格により大きな重みを与え,価格の変化により迅速に反応する.
双均線における急速SMAのパラメータは短く設定され,価格の変化に迅速に反応する.緩慢VWMAのパラメータは長く,<unk>波作用がある.短期および長期のトレンドが同じ方向に進んでいるとき,急速SMAは,緩慢VWMAを上方横断すると,買入信号を生じ,下方横断すると,売り信号を生じます.
この戦略は同時に,価格が不利な方向に走るときに,リスクを制御するために,タイミングでストップするメカニズムを設定する.
優位分析
- 市場動向の変化に迅速に対応する
- 撤収はコントロールされ,止損メカニズムがリスクをコントロールする
- シンプルで直感的で理解しやすい
- パラメータの調整により,異なる市場環境に対応して最適化できます.
リスク分析
- 双重均線戦略は多頭市場への偽信号を容易にする
- 適切なパラメータを選択し,誤った設定で損失を発生させる
- Marktの突発的な事件によって,時折頭痛が起こることもあります.
リスク管理の方法:
- トレンドフィルターで確認
- パラメータの設定を最適化
- 損失を抑える戦略を導入し,単一損失を合理的に制御する
最適化の方向
この戦略は以下の点で最適化できます.
- RSI,ブリンラインなどの他の技術指標と組み合わせて確認し,信号の正確性を向上させる
- 平均線参数長さを最適化して,異なる周期に応じて参数調整
- 取引量指数と組み合わせて,大量のエネルギーが入る出力点で取引する
- 回測結果に応じてパラメータを調整し,最適なパラメータを選択
- ダイナミックストップを使用して,市場の変動に応じてストップポイントを調整します.
要約する
この戦略は全体的に非常に実用的なトレンド追跡戦略である.これは,簡単な直感的な二重平均線交差を用い,取引信号を生成し,急速平均線と遅い平均線を組み合わせることで,市場のトレンドの変化を効果的に捉えることができる.ストップダストメカニズムは,また,優れたリスク管理を可能にする.他の指標とパラメータの最適化と組み合わせることで,戦略の取引効果をさらに向上させることができる.
Source
Pine
/*backtest
start: 2023-11-23 00:00:00
end: 2023-11-28 00:00:00
period: 15m
basePeriod: 5m
exchanges: [{"eid":"Futures_Binance","currency":"BTC_USDT"}]
*/

//@version=4
//strategy(title="Bitlinc Entry v0.1 VWMA / SMA / MRSI SQQQ 94M", overlay=true, initial_capital=10000, currency='USD')

strategy(title="Bitlinc Entry v0.1 VWMA / SMA / MRSI SQQQ 94M", overlay=true)Strategy parameters
Related strategies
Comment
All comments (0)
No data
- 1