ダブル移動平均クロスオーバートレンド戦略

概要
双均線交差トレンド戦略は,移動平均に基づく取引戦略である.それは,快線EMAと慢線SMAの交差を,買入と売却の信号として使用し,MACD指標の偏移と組み合わせて,フィルター信号である.この戦略は,価格,傾向,動量などの複数の要因を同時に考慮し,比較的完全な取引システムを形成する.
戦略原則
この戦略は,EMAとSMAの2つの移動平均を使用する.EMAの長さは200日,SMAの長さは100日である.価格上昇が2つの平均線を突破すると,買いのシグナルが生じ,価格下落が2つの平均線を突破すると,売りのシグナルが生じます.これは,振動的な傾向と短期的な回調を効果的にフィルターすることができます.
信号の信頼性をさらに高めるために,戦略はMACD指標を導入した.価格がEMAとSMAを突破し,信号を形成するときに,MACDの快線が下の側から慢線を突破し,MACD柱状図が0軸の上にあり,本当の買いの信号を誘発するだけです.逆に,MACDの快線が上から慢線を突破し,MACD柱状図が0軸の下にあるときに,本当の売りの信号を誘発します.
さらに,戦略は,ストップ・ロズとストップ・ストップを設定している.戦略がポジションを開設した後に,ユーザが設定した比率に基づいて,ストップ・ロズとストップ・ストップを計算して設定している.これにより,単一取引のリスクを効果的に制御することができる.
全体として,この戦略は,複数の指標を考慮し,購入・販売のシグナルに厳格なフィルタリング条件を設定し,ストップ・ストップ・ストップのリスクを管理し,比較的厳格で完全な取引システムを形成しています.
優位分析
双均線交差トレンド戦略には以下の利点があります.
-
複数の指標を組み合わせ,価格,傾向,動力を総合的に考慮し,信号に厳格なフィルタリング条件を設定し,偽信号を効果的に回避し,信号の信頼性を向上させる.
-
2つの異なるパラメータの移動平均を使用することで,市場のトレンドをよりよく識別し,揺れをフィルターできます.高速EMA線は,価格変化をタイムリーに追跡するために使用されます.遅いSMA線は,長期のトレンドを判断するために使用されます.
-
MACD指数には,異なる市場の特徴に合わせて調整できるパラメータを設定できます.MACDの設定は,取引シグナルが価格,トレンド,動力のサポートを同時に取得することを保証し,強力な応用価値があります.
-
SIZE_MATHFUNCを回避するために,単一の取引の損失を最大限に制御するために,ストップ・ロスト・ストップポイントを設定します.
単一損失の過大リスク. 合理的な割合のストップフード設定は,利益の一部をロックし,利益の後に市場リスクの露出を減らすことができます. -
この戦略のパラメータは柔軟に設定でき,最適化結果に応じて戦略に調整することができる.実用性は非常に強い.異なる市場とパラメータのテストのための最適化スペースは大きい.
リスク分析
双均線交差トレンド戦略にはいくつかのリスクがあり,主に以下のいくつかの側面に集中しています.
-
株価が激しく揺れると,EMAとSMAが誤って交差し,取引シグナルが頻繁に開閉される.これは取引頻度と手数料の支出を増加させる.
-
MACD指標は,特に振動の勢いがまだ不明な過程で,偽突破が発生する可能性があります.この場合,シグナルも信頼できないため,不必要な損失を引き起こす可能性があります.
-
止損設定の位置と割合は,<unk>損結果に大きな影響を与える.止損設定が小さすぎると,被覆されるリスクがある.止損設定が大きすぎると,単一の損失が過重である可能性がある.これは,最適なパラメータを見つけるために十分なテストを必要とする.
-
移動平均はトレンドを追跡する指標として,価格が急速に反転するときに,その指示効果は割引されます.戦略は止損に間に合わずに価格が反転して大きな損失を招く可能性があります.
解決策は以下の通りです.
-
激しい振動状況に対応して,移動平均のパラメータを適切に調整して,低パラメータのEMAとSMAを使用して,交差回数を減らすことができます.
-
MACDの0軸上下突破のフィルター条件を追加することで,偽突破を一定程度に減らすことができる。また,KDJ,BOLLなどの他の指標を組み合わせることも考えられる。
-
停止損失位置と比率の設定は,充分な反省と最適化が必要であり,最適なパラメータを見つけます.この基礎で,継続的な監視と動的調整も考慮する必要があります.
-
価格の急速な反転を認識するメカニズムを設定できます. 異常な反転が発見された場合,ポジションを縮小するまたは取引戦略を一時停止する緊急措置をとり,リスクの穴を制御します.
最適化の方向
双均線交差トレンド戦略のさらなる最適化には余裕があり,以下のような部分に重点を置いています.
-
より多くの指標を組み合わせてテストし,より優れたパラメータを探します.例えば,BOLLチャネルを導入し,波動率の影響を考慮します.
-
移動平均の長さのパラメータを最適化して,異なる市場条件下で最適なパラメータの組み合わせを見つけます.パラメータのローリング最適化も選択肢です.
-
より科学的に合理的にストップ・ストップ・ストラップ戦略を設定する.例えば,追跡ストップを導入するか,または歴史的な統計結果に基づいて動的リスク・リターン比率を設定するなど.これは戦略の安定性をさらに向上させることができる.
-
価格の異常な逆転の自動識別と緊急メカニズムを確立する. 極端な状況では,ポジションを積極的に縮小するか,戦略を一時停止して,巨額の損失を回避する.
-
取引品種を拡張する,例えば外貨,デジタル通貨などの他の品種. 異なる品種のパラメータの強さをテストする,戦略の適用範囲を広げること.
-
戦略を最適化する資金管理策,例えば定額取引,固定ポジション比率など.単一損失のリスクを制御し,全体的な資金曲線をより平らにする.
要約する
双均線交差トレンド戦略は,多重な要素を総合的に考慮し,取引信号を発信する際に価格,トレンド,動量の複数の指標のサポートを必要とし,その結果,信号の信頼性を確保する. 戦略はまた,移動ストップ・ロスト・ストップを採用し,単一取引のリスクを効果的に制御することができる. この戦略のパラメータ設定は,柔軟で,実用性が強く,自動化取引に適しています.
しかし,いかなる戦略も完璧であることは不可能である.この戦略は,頻繁な取引,偽の突破,および停止位置の設定などの問題などで,その適用においていくつかの困難に直面する.これは,パラメータの組み合わせを最適化すること,新しい技術指標の組み合わせを導入すること,および停止機構の改善など,多くの面で取り組みを進める必要があり,戦略の安定性と収益性をさらに強化する.
全体として,双均線交差トレンド戦略は,比較的完全で厳格な取引システムを形成している.後の研究と応用において,この戦略は,継続的な最適化と改善によって,より大きな実戦価値を発揮する見込みがある.
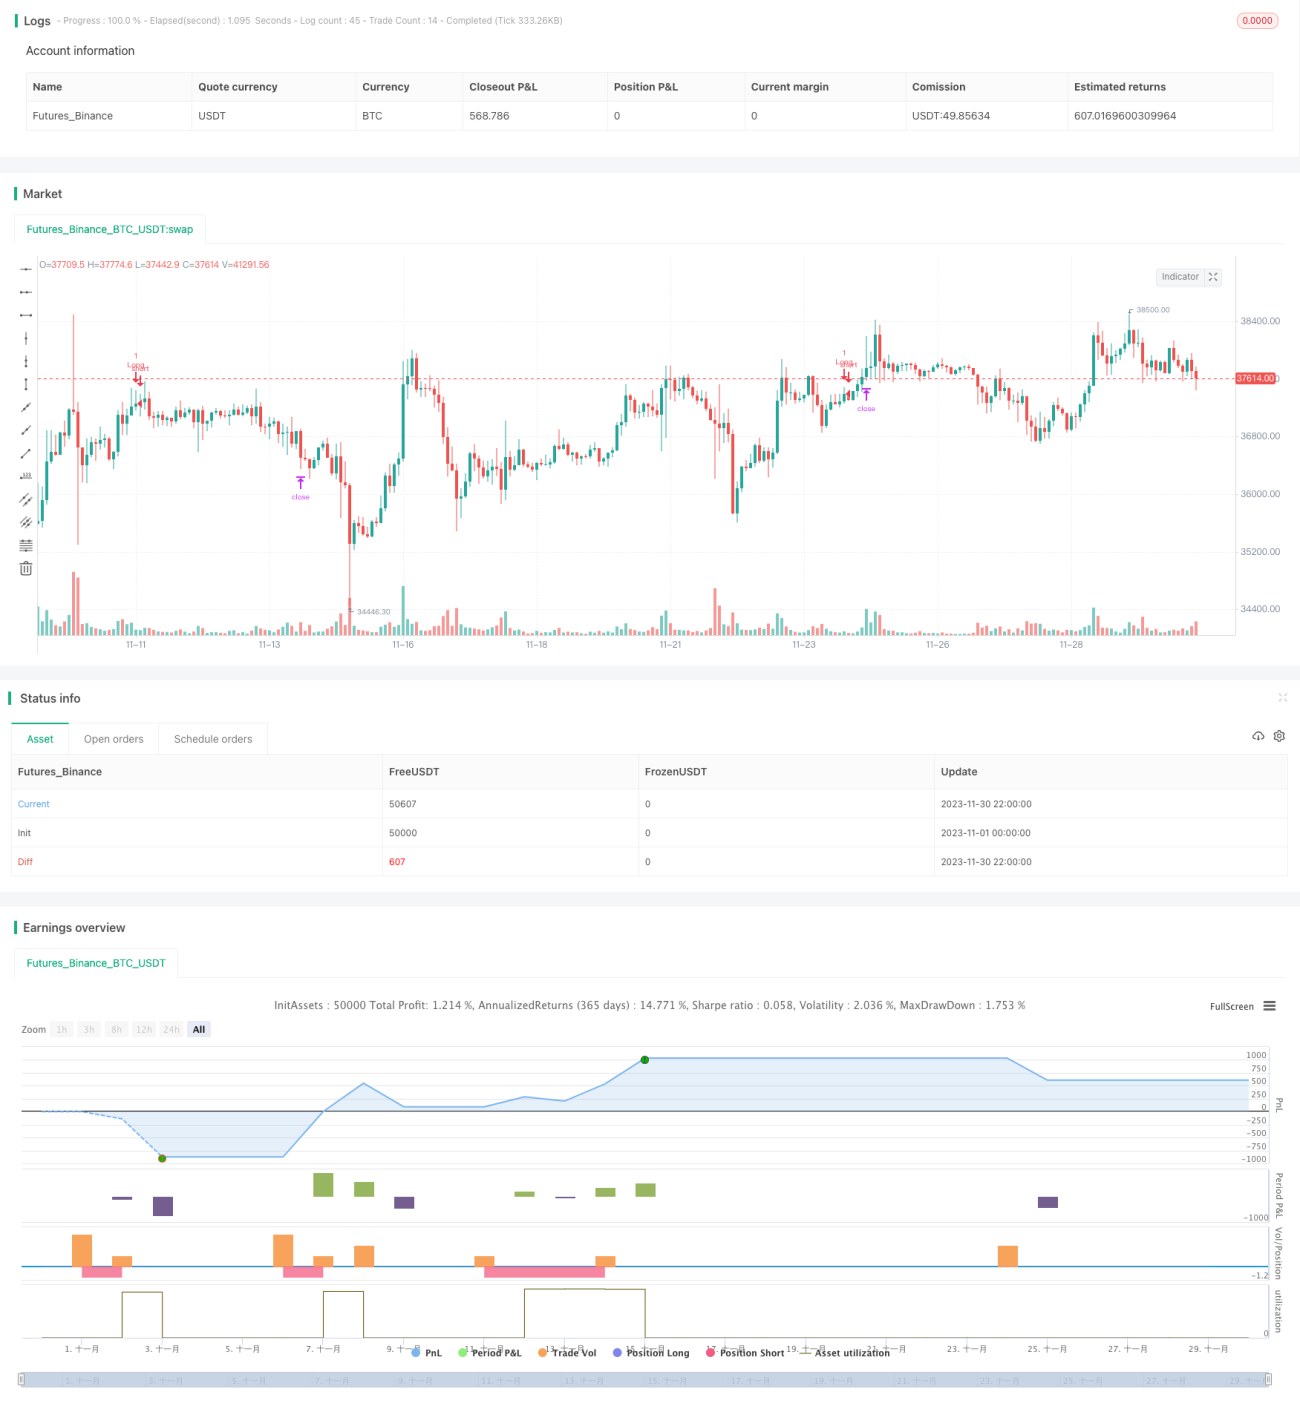
/*backtest
start: 2023-11-01 00:00:00
end: 2023-11-30 23:59:59
period: 2h
basePeriod: 15m
exchanges: [{"eid":"Futures_Binance","currency":"BTC_USDT"}]
*/

//@version=4
// Hi,
// This is my first strategy made by myself(except for the MACD indicator). I'm publishing this to get myself out there and for some newer people to see how a basic strategy works. All credits go to Zen&TheArtofTrading, for teaching me almost everything I know about Pinescript
// The strategy is basically an MACD crossover trend strategy. If the MACD line crosses the signal line upward, above the zero point of the histogram, while the price is above 200 EMA and 100 SMA it's a buy signal- 1